Development of an analytical dashboard for the CRM system in Airtable
Enterprise Resource Planning (ERP)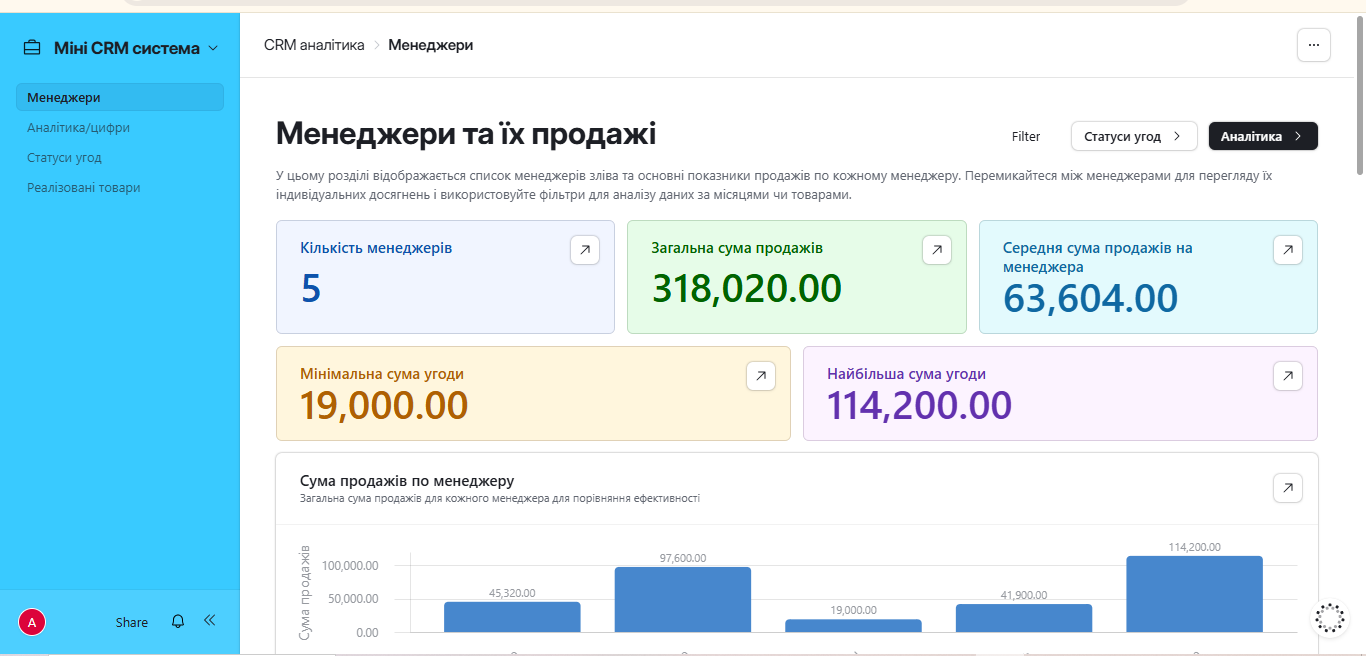
A convenient, interactive, and visually understandable report panel (dashboard) has been developed for a mini-CRM system based on Airtable. The main goal of the project is to transform arrays of raw data into visual analytics that allow a manager or business owner to keep a finger on the pulse of the company.
What has been implemented (Key functionality):
Manager report: A separate panel for tracking the KPI of each employee (total sales amount, average check, minimum/maximum deal, comparative performance charts).
Deal analytics: In-depth analysis of financial indicators and sales dynamics.
Deal statuses: Visualization of the sales funnel for convenient tracking of customer movement at each stage.
Implemented products: Reporting on products/services to understand demand and sales volumes.
Value for business (Why this works great):
Time savings: No more manual reports in spreadsheets. All key metrics are updated in real-time and available on one screen.
Transparency and control: It is extremely convenient for the manager to view the results of the team's work and the individual achievements of each manager.
Quick analysis: Thanks to convenient filters, KPI cards, and charts, analyzing numbers and making management decisions has become much easier.
Convenience: An intuitive interface that does not require additional training for employees.
#airtable #interfaces #DashBoards #reports #analytics #sales #airtable_interface #dashboards #Airtable_reports #CRM