Google Sheets Order Accounting
Online Stores & E-commerce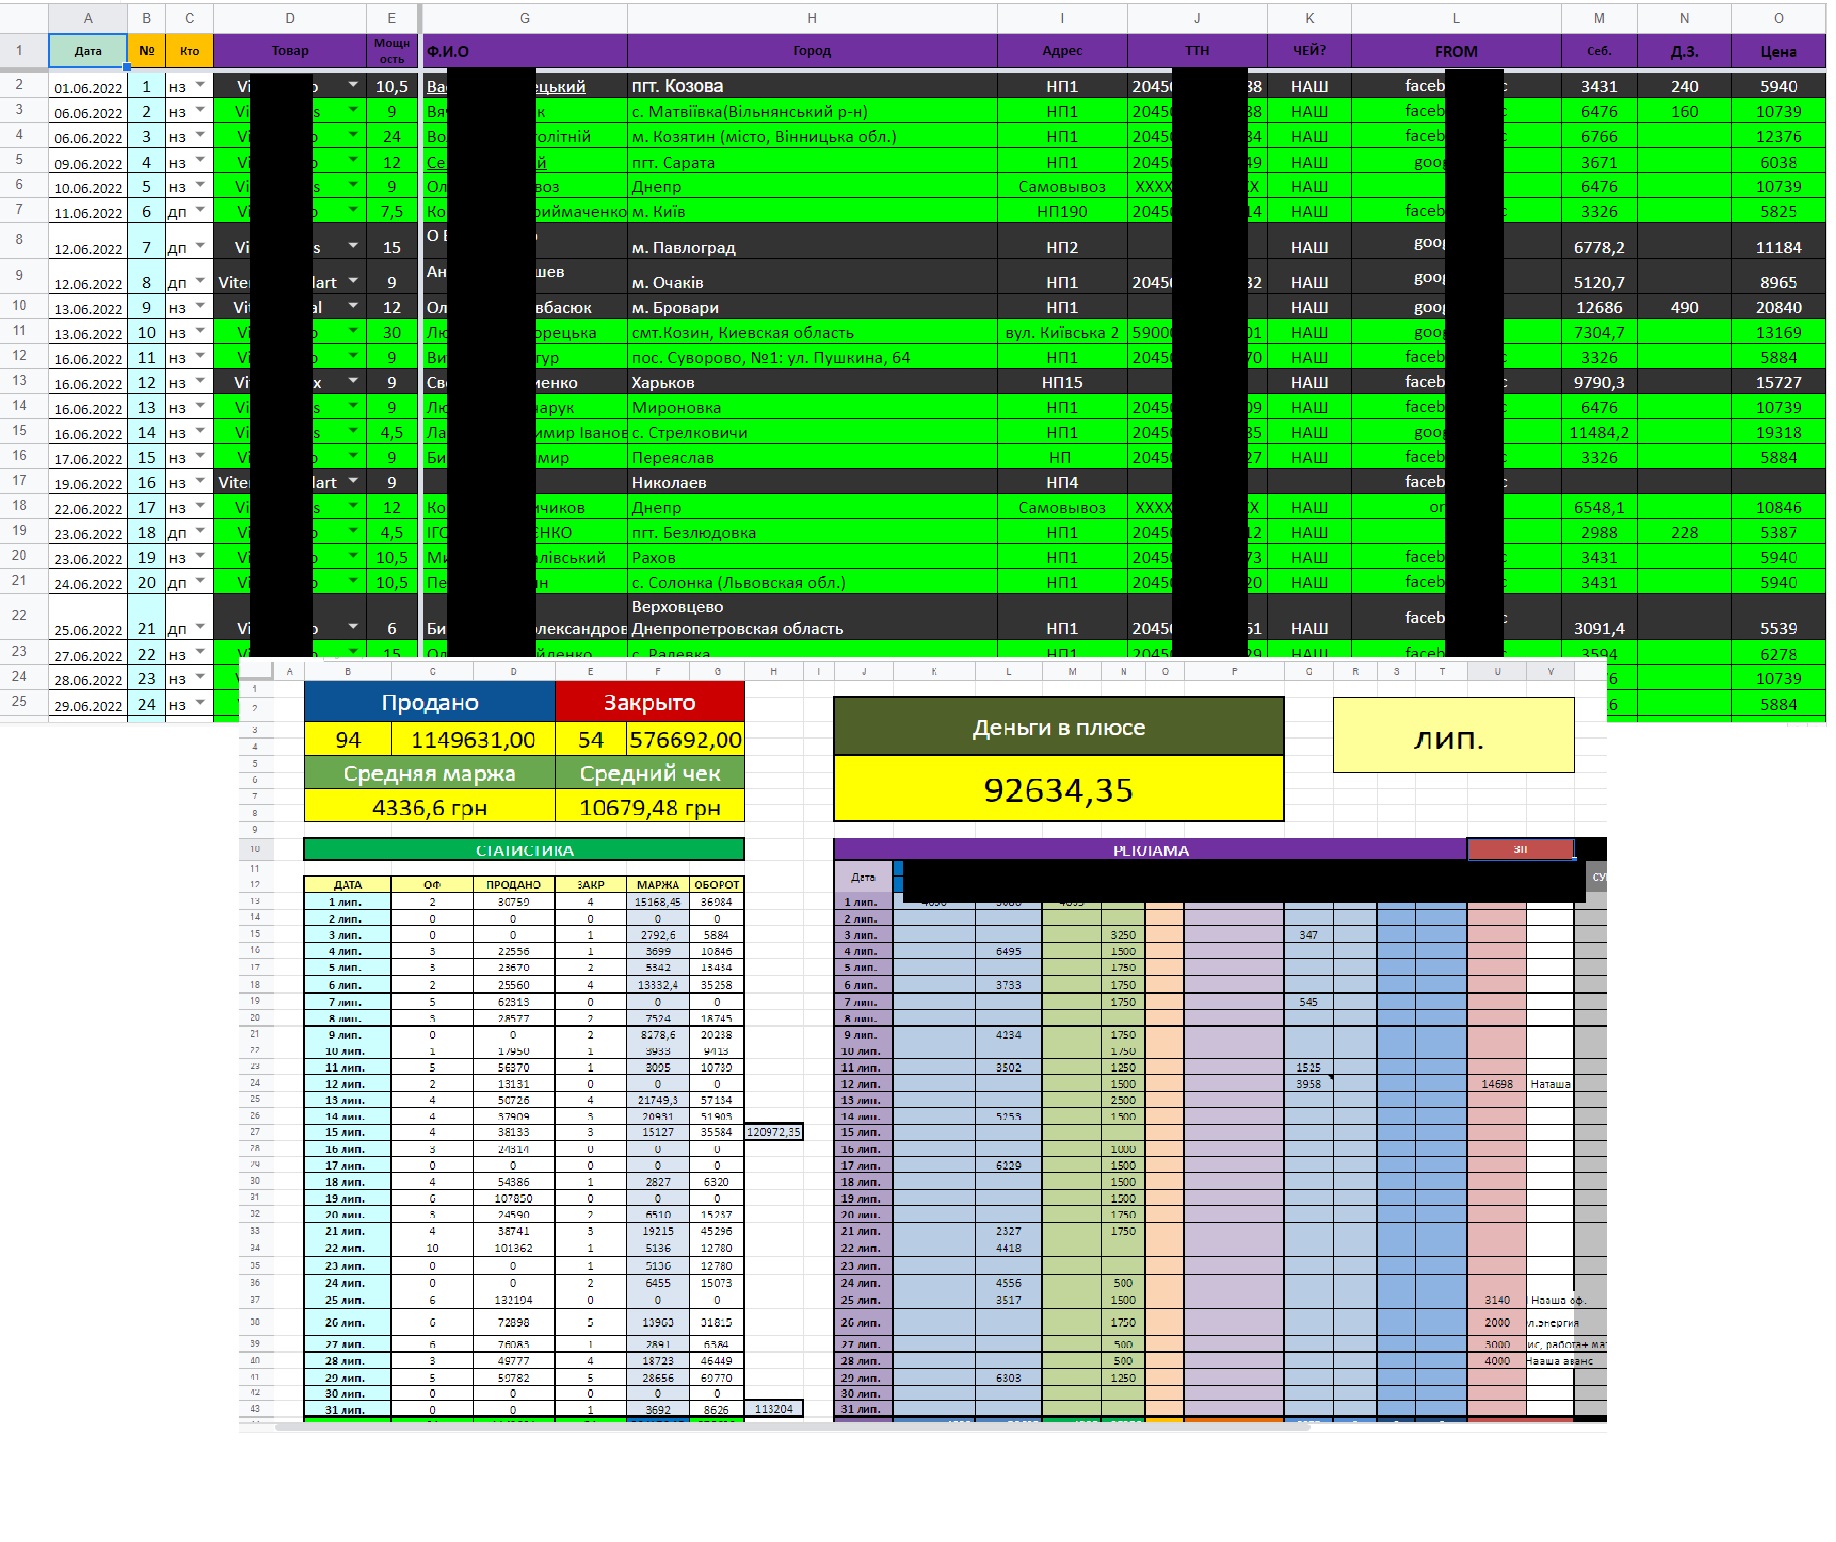
The source data.The table with the input of all the data "manual", the report for each month was made manually for each month separately (any new table each month)
TZ: Maximum all fields to automatize, create a month report from one table and each tab results for each month separately.The possibility of introducing an updated price of value and cost with the drawing of the true price depending on the date of order (e.g. 5.06 price of 100 UAH, and 10.06 price of 200 UAH, the order was 7.06, then it will be drawn 100 UAH, and if it was 12.06, then 200 UAH.completed by:
1 .Lids are imported into the document and by the phone number are drawn into the table.The price and cost of the goods are drawn by the goods and power depending on the date of order.
The monthly report is formed automatically, it is enough to make a copy of the list and indicate the appropriate month.The number of orders is counted correctly if on one date 3 orders under number 123, it is considered as one.All calculations on the report list for months are drawn up by formulas, you don’t have to insert something separately.Then separate tables were created for managers that they fill, the administrator collects data and copies them into this table, sets them additional parameters and based on the assigned parameters in the administrator table - the report is automatically filled according to the month they show (in the management tables).Algorithm: the manager fills a short version of the table (this managers are several) - the administrator copies them of these tables data into their own, assigns them certain parameters - some of them, necessary for reporting, are exported to the tables of the managers and they are formed from them.in the admin table the general report for all menagers