Schedule
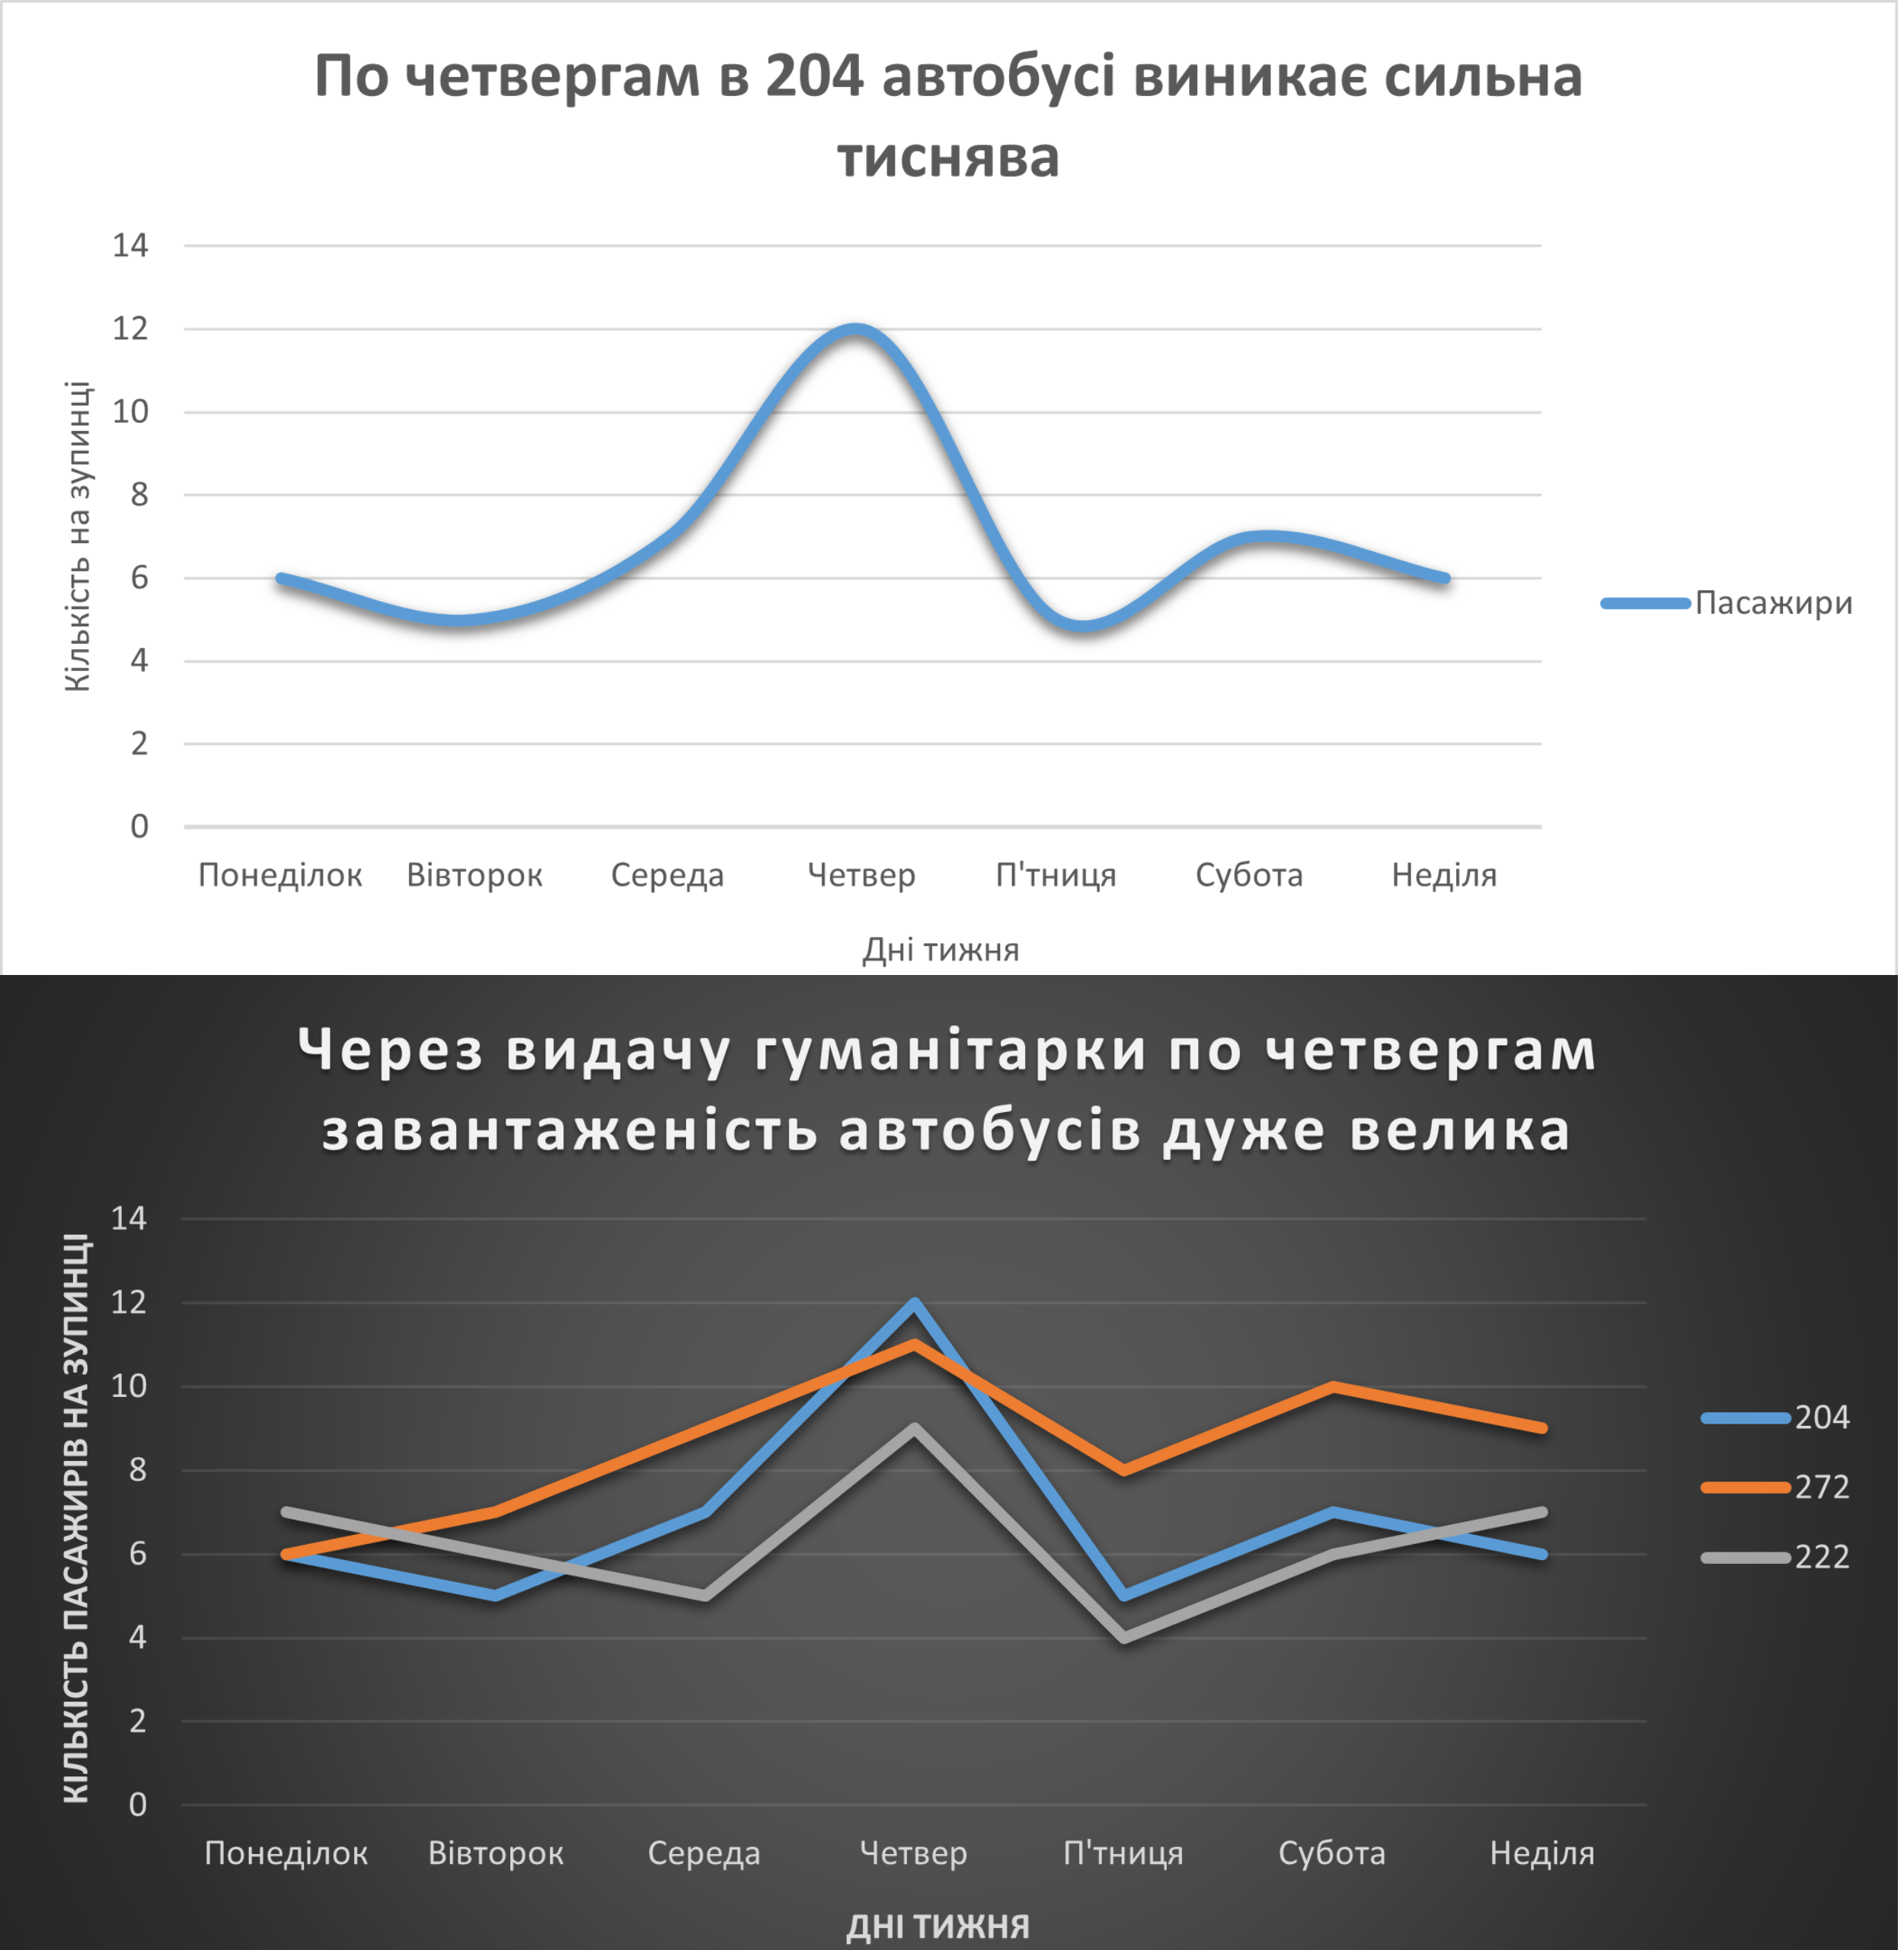
A line chart is a visual representation of data or the relationship between quantities, meaning the chart shows how one indicator changes in relation to another. The title is chosen in such a way that it provides summary information about the data rather than just naming them: chart, frequency, number of passengers, etc.
For example:
how the price changes over time;
how the number of readers increases.
What it consists of:
Horizontal axis (X) - time or categories;
Vertical axis (Y) - values;
Line, points, or bars that show the data.
#visualization #data_visualization #Chart
For example:
how the price changes over time;
how the number of readers increases.
What it consists of:
Horizontal axis (X) - time or categories;
Vertical axis (Y) - values;
Line, points, or bars that show the data.
#visualization #data_visualization #Chart
 Kharkiv