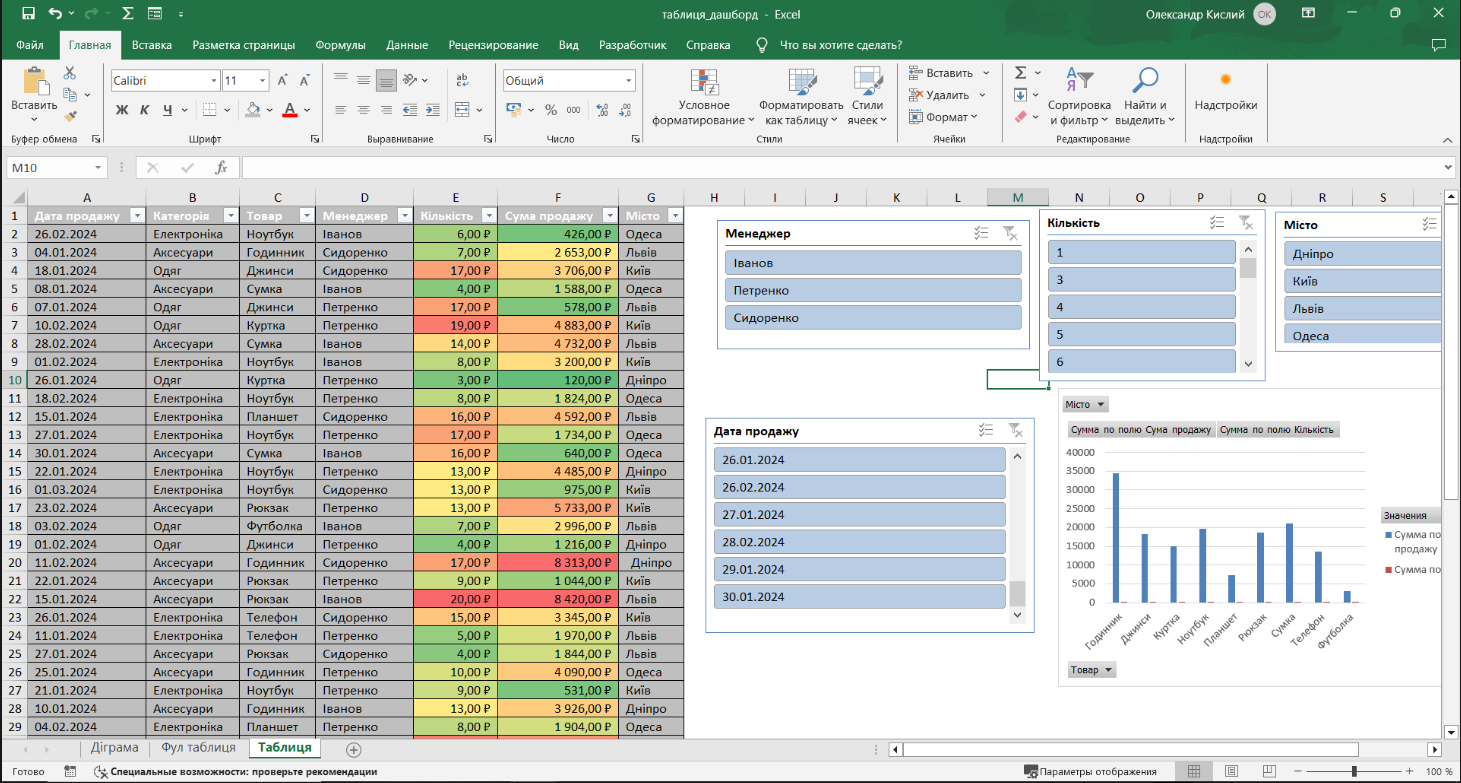
Created a dashboard in Microsoft Excel for analyzing the company's sales. Functionality:
Dynamic filters by managers, cities, dates, and product categories
Automatic highlighting of data using conditional formatting
Charts and pivot tables for visual representation of data
Fully automated report without the use of macros
Such a dashboard helps to quickly obtain analytics suitable for sales departments, financial analysts, and managers.