Project description:
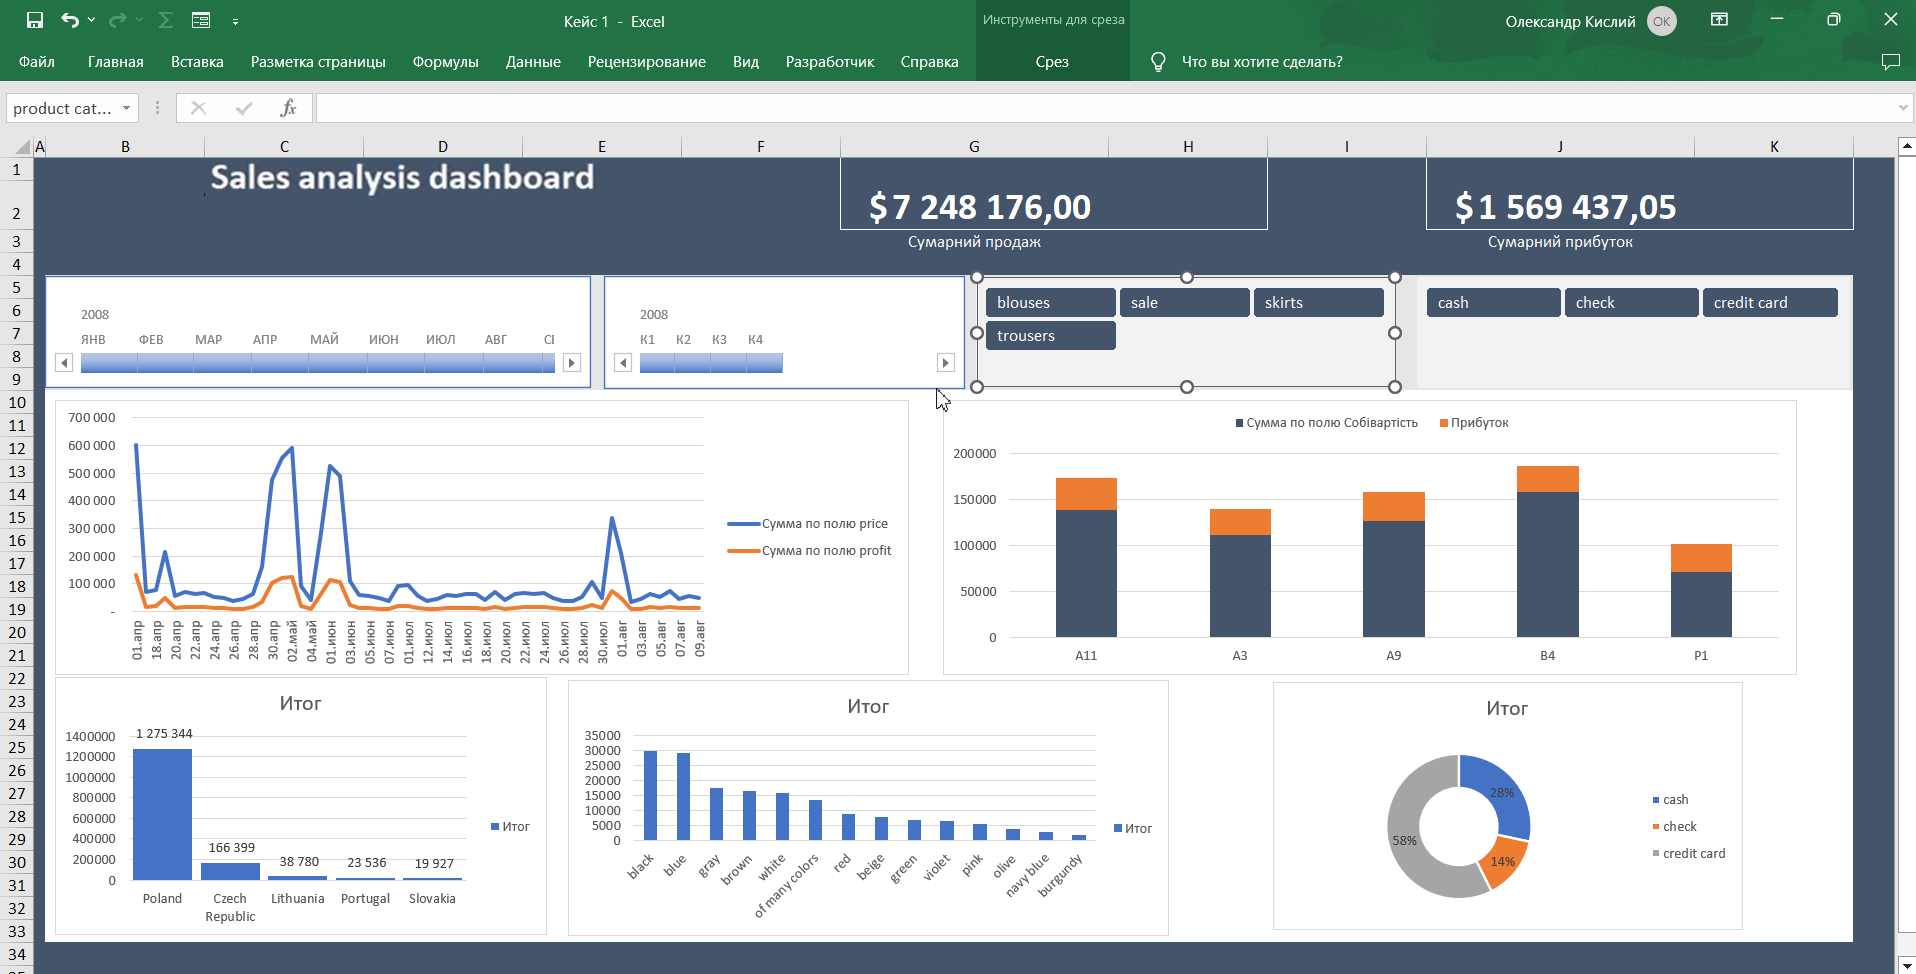
This interactive sales analysis dashboard helps visualize key business metrics, track profit, and analyze sales dynamics by product categories, countries, and payment methods.
Tools used:
Excel (pivot tables, charts, conditional formatting)
Power Query (data processing and transformation)
Segments and timeline (for data filtering)
Excel formulas (SUMIFS, INDEX+MATCH, GETPIVOTDATA)
Functionality:
Visualization of total revenue and profit of the company
Sales dynamics by months and quarters
Analysis of the most profitable product categories
Payment distribution (cash, check, card)
Interactive filters for quick analytics