Interactive dashboard for analyzing the effectiveness of advertising campaigns
Data Processing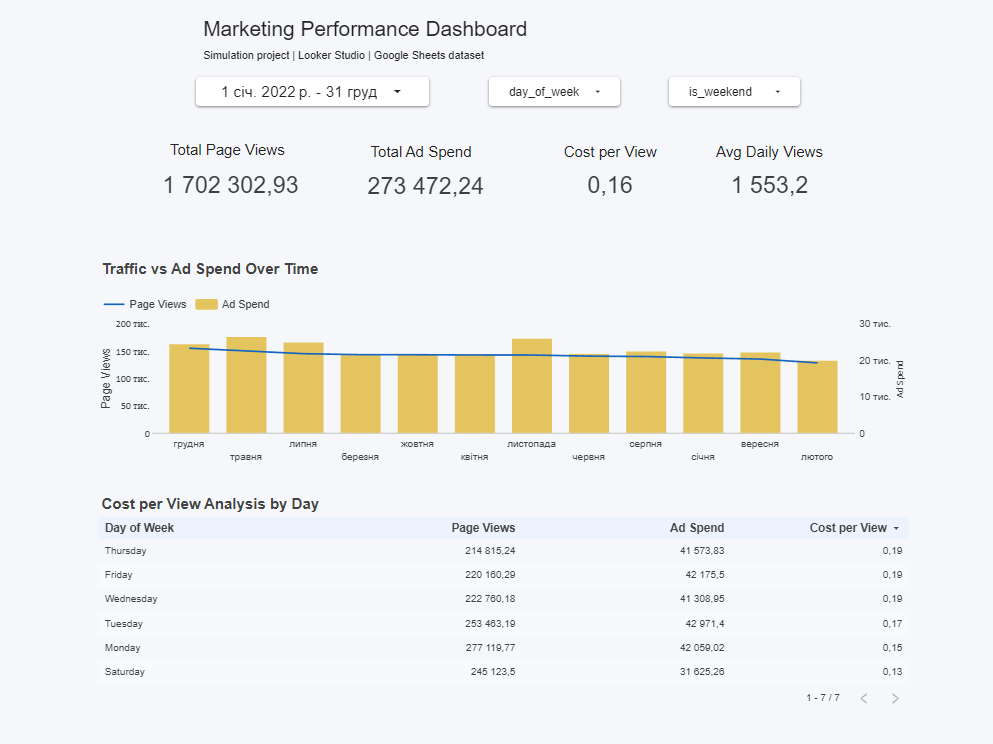
Interactive dashboard in Google Looker Studio for analyzing the effectiveness of advertising campaigns and web traffic.
Data source: Google Sheets (marketing dataset)
Data updates: automatic
Interactive filters: period, day of the week, weekends
The dashboard includes:
• KPI block with key indicators:
— Total Page Views
— Total Ad Spend
— Cost per View (CPV)
— Average Daily Views
• Comparison with the previous period (dynamics in %)
• Dual-axis chart: traffic vs advertising expenses
• Performance analysis by days of the week
• Calculation of CPV through calculated fields
• Interactive table with sorting
The dashboard allows for a quick assessment of advertising effectiveness, identification of seasonality, and patterns in user behavior.
Tools:
#GoogleSheets
#LookerStudio
#Dashboard
#DataVisualization
#MarketingAnalytics
Data source: Google Sheets (marketing dataset)
Data updates: automatic
Interactive filters: period, day of the week, weekends
The dashboard includes:
• KPI block with key indicators:
— Total Page Views
— Total Ad Spend
— Cost per View (CPV)
— Average Daily Views
• Comparison with the previous period (dynamics in %)
• Dual-axis chart: traffic vs advertising expenses
• Performance analysis by days of the week
• Calculation of CPV through calculated fields
• Interactive table with sorting
The dashboard allows for a quick assessment of advertising effectiveness, identification of seasonality, and patterns in user behavior.
Tools:
#GoogleSheets
#LookerStudio
#Dashboard
#DataVisualization
#MarketingAnalytics