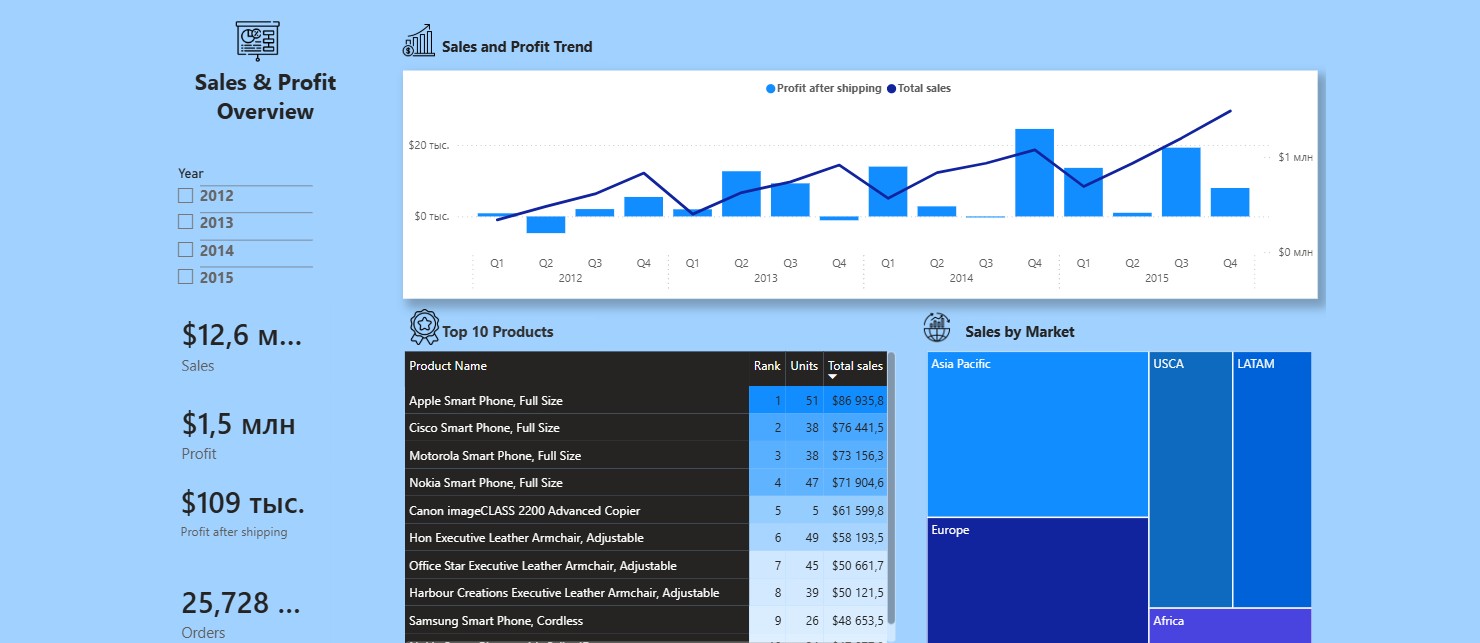
Task: Transform a large raw dataset with business metrics into a clear, interactive analytical dashboard for automatic KPI tracking.
What has been done:
ETL Stage (Power Query): Loaded the raw dataset, performed data cleaning from anomalies, set correct data types, and optimized the structure for further work.
Modeling: Created a logical data model, highlighting fact tables and necessary reference tables for convenient filtering.
Metric Calculation (DAX): Wrote custom measures in DAX for calculating key business indicators in dynamics and comparisons.
Visualization and UI/UX: Developed the dashboard design with a flexible slicing (filtering) system that allows the business owner to drill down reports with one click.
#powerbi #dax #powerquery #bi #dashboard #analytics #excel #analytics #dashboard #database #businessanalytics
What has been done:
ETL Stage (Power Query): Loaded the raw dataset, performed data cleaning from anomalies, set correct data types, and optimized the structure for further work.
Modeling: Created a logical data model, highlighting fact tables and necessary reference tables for convenient filtering.
Metric Calculation (DAX): Wrote custom measures in DAX for calculating key business indicators in dynamics and comparisons.
Visualization and UI/UX: Developed the dashboard design with a flexible slicing (filtering) system that allows the business owner to drill down reports with one click.
#powerbi #dax #powerquery #bi #dashboard #analytics #excel #analytics #dashboard #database #businessanalytics