Revenue Metrics
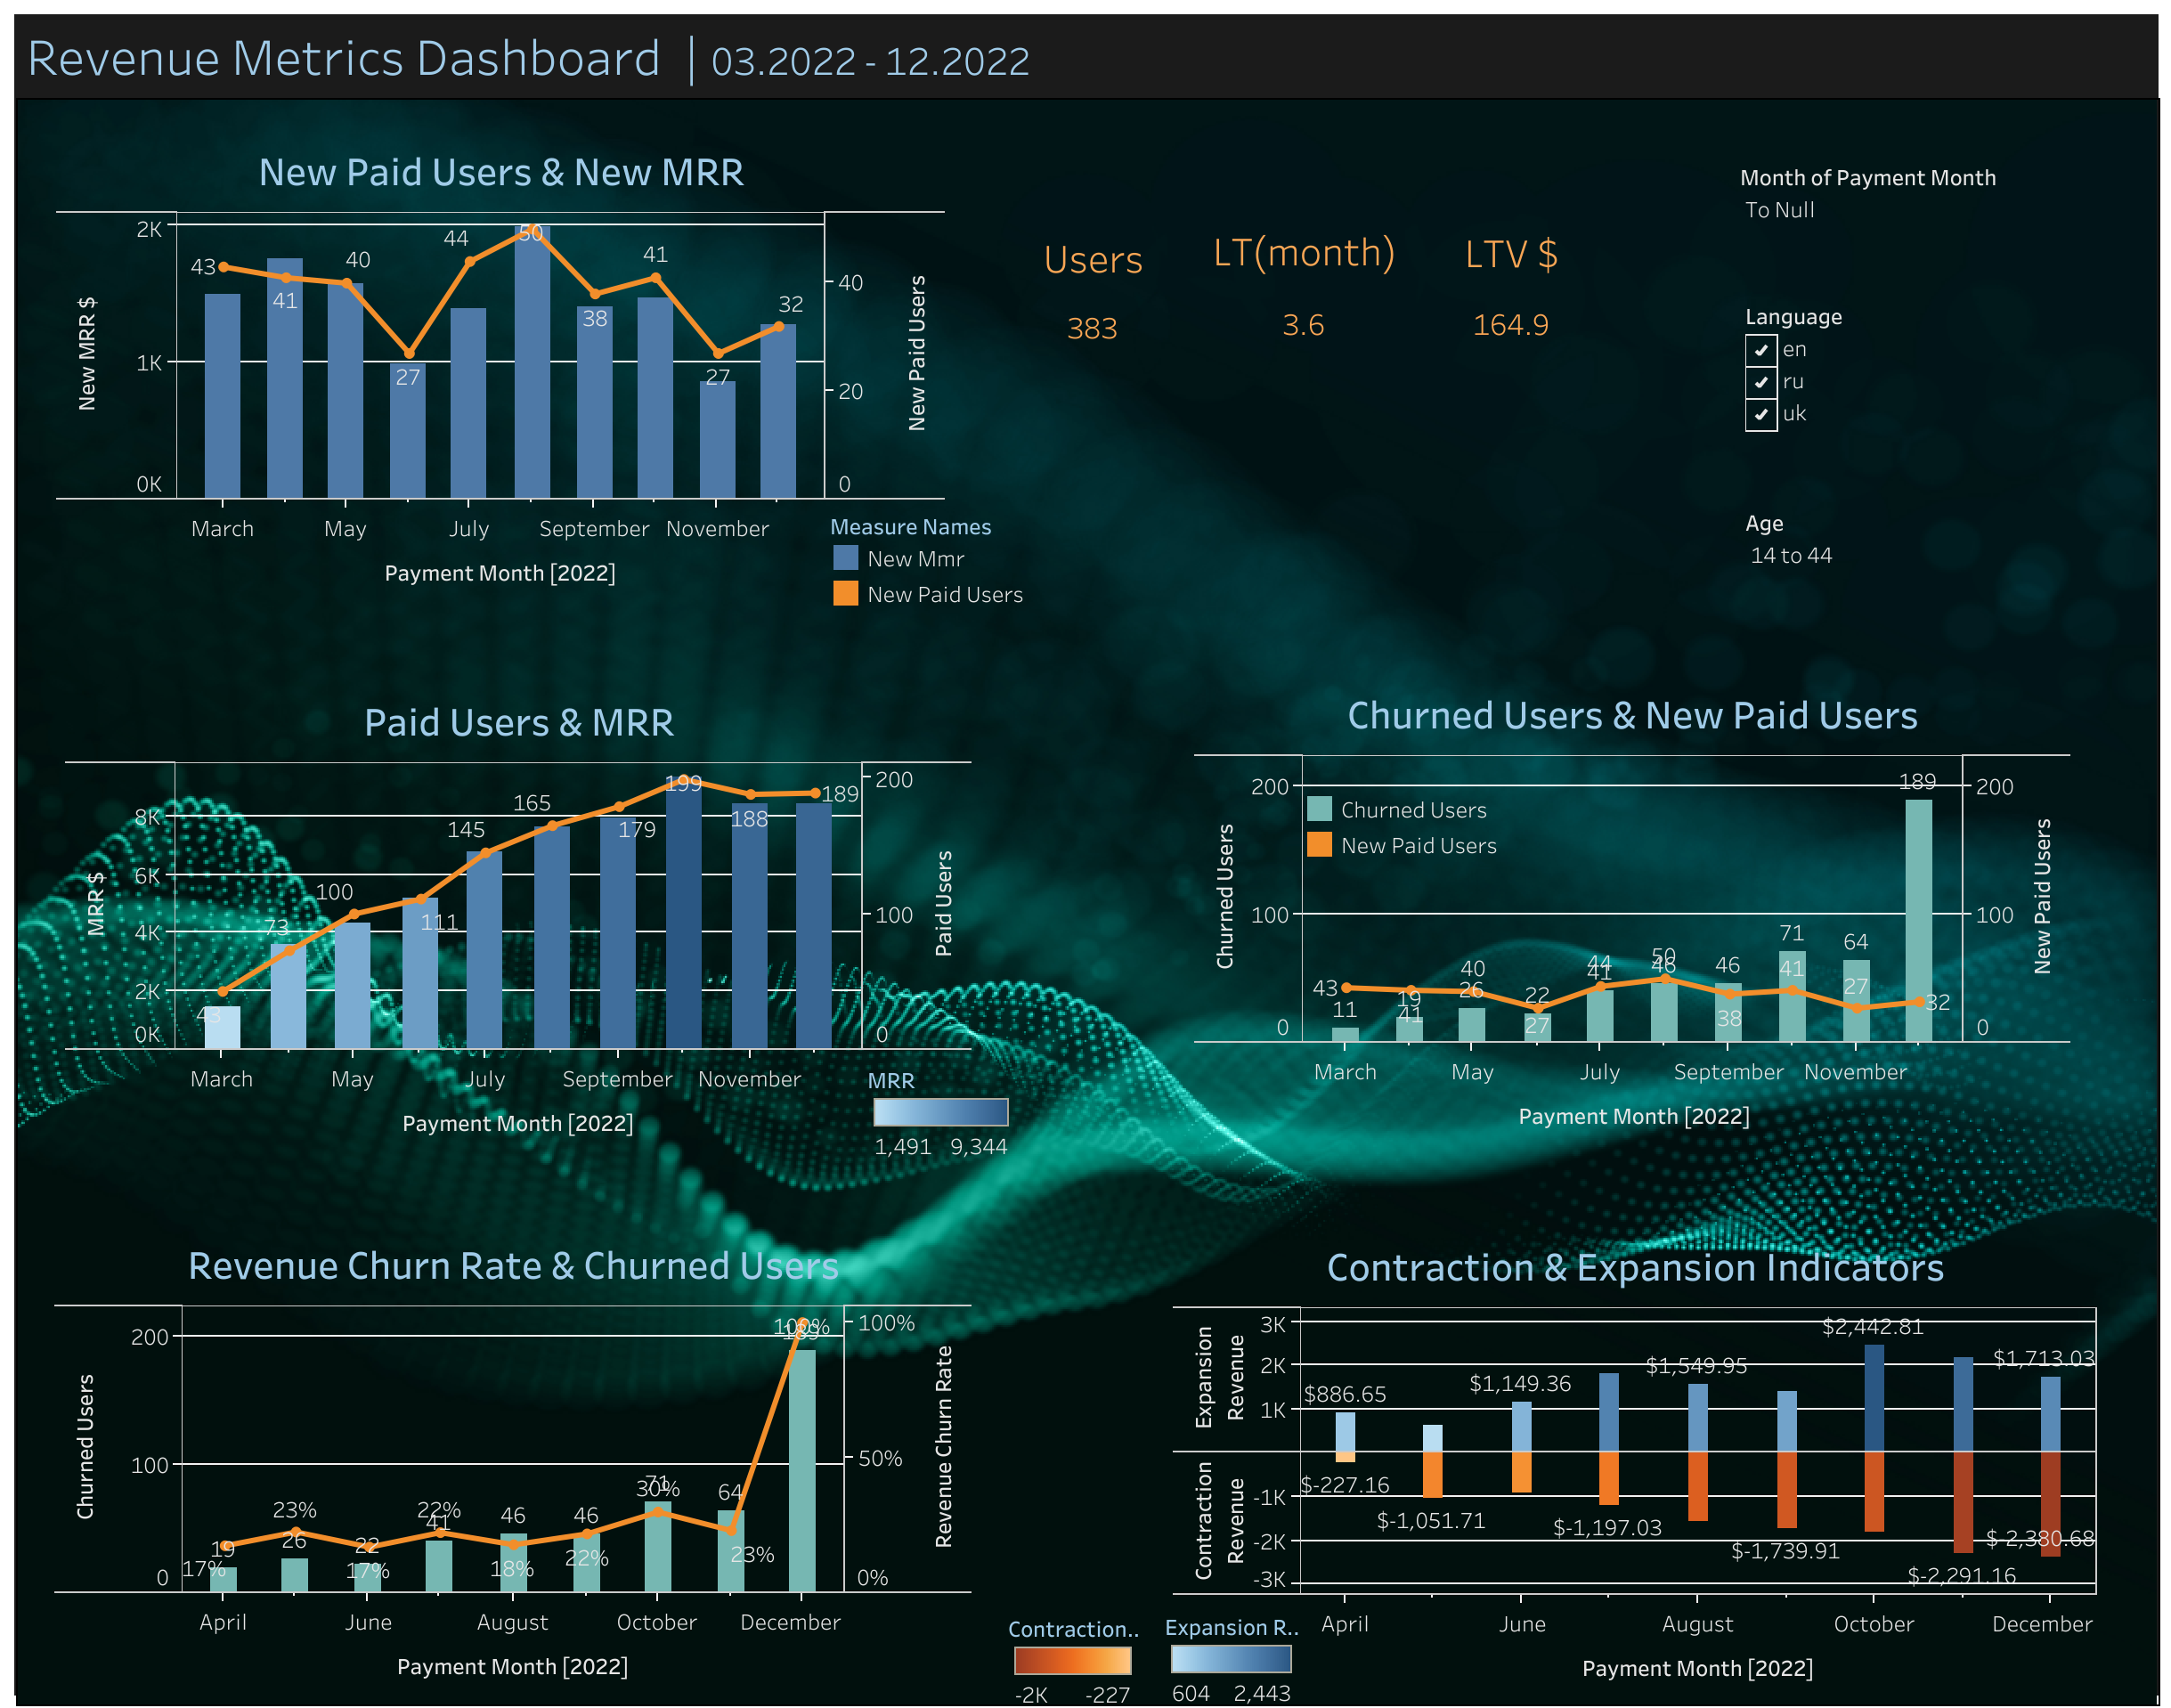
This project involves the creation of an informational dashboard for tracking and analyzing key revenue indicators. The dashboard contains five charts highlighting new paying users, revenue (MRR), the number of users who have unsubscribed (Churned Users), and indicators of revenue expansion and contraction. Interactive filters for user language and age allow for a more detailed analysis of revenue dynamics over different periods.
The analysis included studying the number of new paying users, the level of monthly recurring revenue (MRR), user churn dynamics (Churned Users), and the impact of expansions and contractions on revenue. Key findings showed an increase in new paying users in the middle of the year, which positively affected MRR. However, at the end of the year, there was an increase in user churn, which reduced overall revenue. A significant impact of revenue expansions in certain months was also found, which compensated for losses from contractions. This information will help product managers make strategic decisions regarding user retention and revenue growth.
The analysis included studying the number of new paying users, the level of monthly recurring revenue (MRR), user churn dynamics (Churned Users), and the impact of expansions and contractions on revenue. Key findings showed an increase in new paying users in the middle of the year, which positively affected MRR. However, at the end of the year, there was an increase in user churn, which reduced overall revenue. A significant impact of revenue expansions in certain months was also found, which compensated for losses from contractions. This information will help product managers make strategic decisions regarding user retention and revenue growth.
 Kyiv
Kyiv