Processed a raw dataset (≈50,000 rows), conducted cleaning, aggregation, and built an interactive analytical dashboard for an e-commerce clothing store.
What was done:
Structured the data and created several pivot tables.
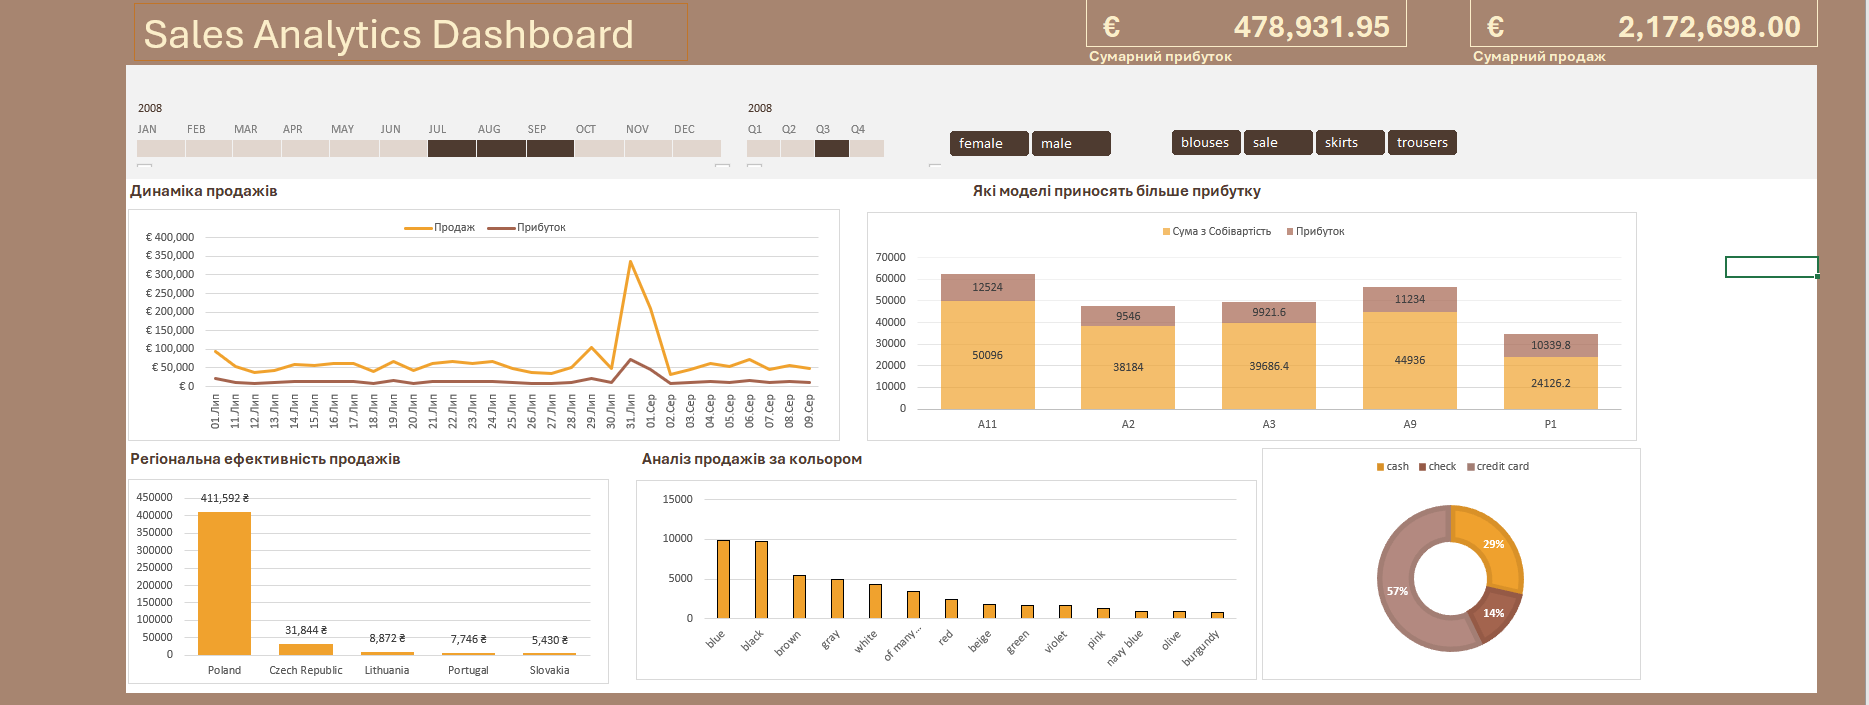
Built an interactive Sales Analytics Dashboard, which includes:
- sales and profit dynamics;
- analysis of product model profitability;
- sales distribution by country;
- sales analysis by colors;
- payment structure (cash / credit card / check).
Added filters by product category, date, country, and buyer gender.
Aligned data formats, derived key metrics, built charts and the dashboard in a unified style.
Result: The dashboard allows for a quick assessment of sales effectiveness, model profitability, identification of peak periods, and key profit drivers.
What was done:
Structured the data and created several pivot tables.
Built an interactive Sales Analytics Dashboard, which includes:
- sales and profit dynamics;
- analysis of product model profitability;
- sales distribution by country;
- sales analysis by colors;
- payment structure (cash / credit card / check).
Added filters by product category, date, country, and buyer gender.
Aligned data formats, derived key metrics, built charts and the dashboard in a unified style.
Result: The dashboard allows for a quick assessment of sales effectiveness, model profitability, identification of peak periods, and key profit drivers.