Comprehensive sales analysis in Google Sheets
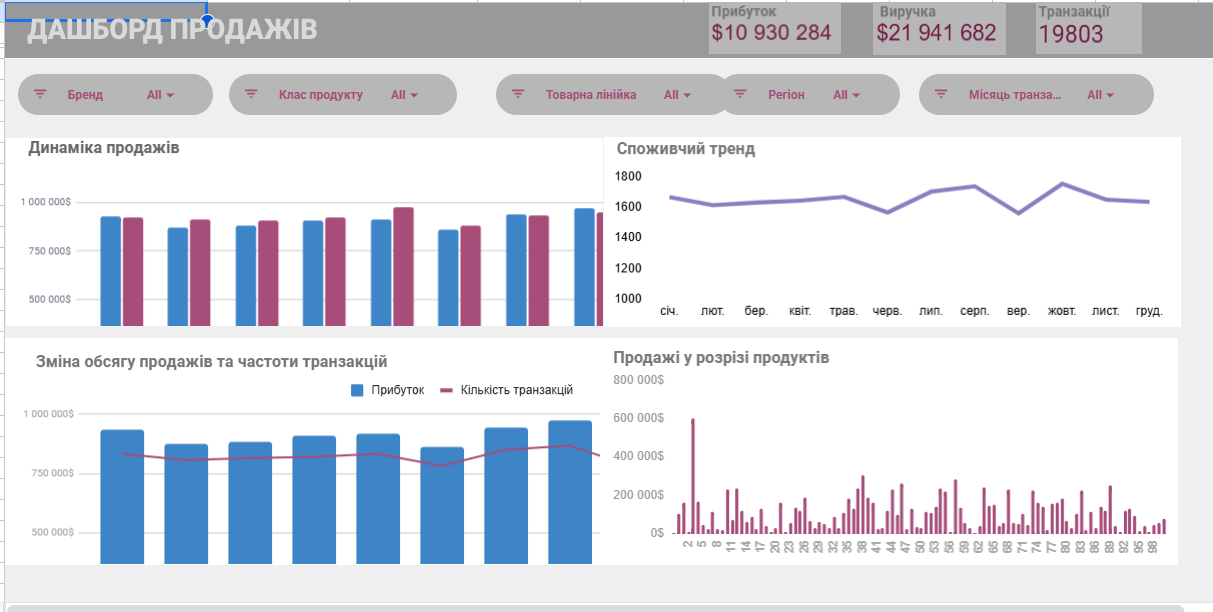
The project covered the full cycle of sales data analysis (over 20,000 transactions) to assess profitability, dynamics, and customer activity:
- Collection and integration of data from heterogeneous sources (Excel, CSV, GitHub, Wikipedia, other Google Sheets).
- Conducted Data Profiling, removal of duplicates and gaps. Created new analytical columns. Merged customer and transaction data into one table.
- Created Pivot Tables for analysis. Built charts for visualization.
- Created a final interactive report, set up for dynamic filtering using Slicers, to support quick business decisions.
 Kyiv
Kyiv