The client needs a single report that shows the results of organic and paid content on TikTok and YouTube daily: views, likes, revenue, and ROI for the day and week, without manual aggregation from different sources.
Solution
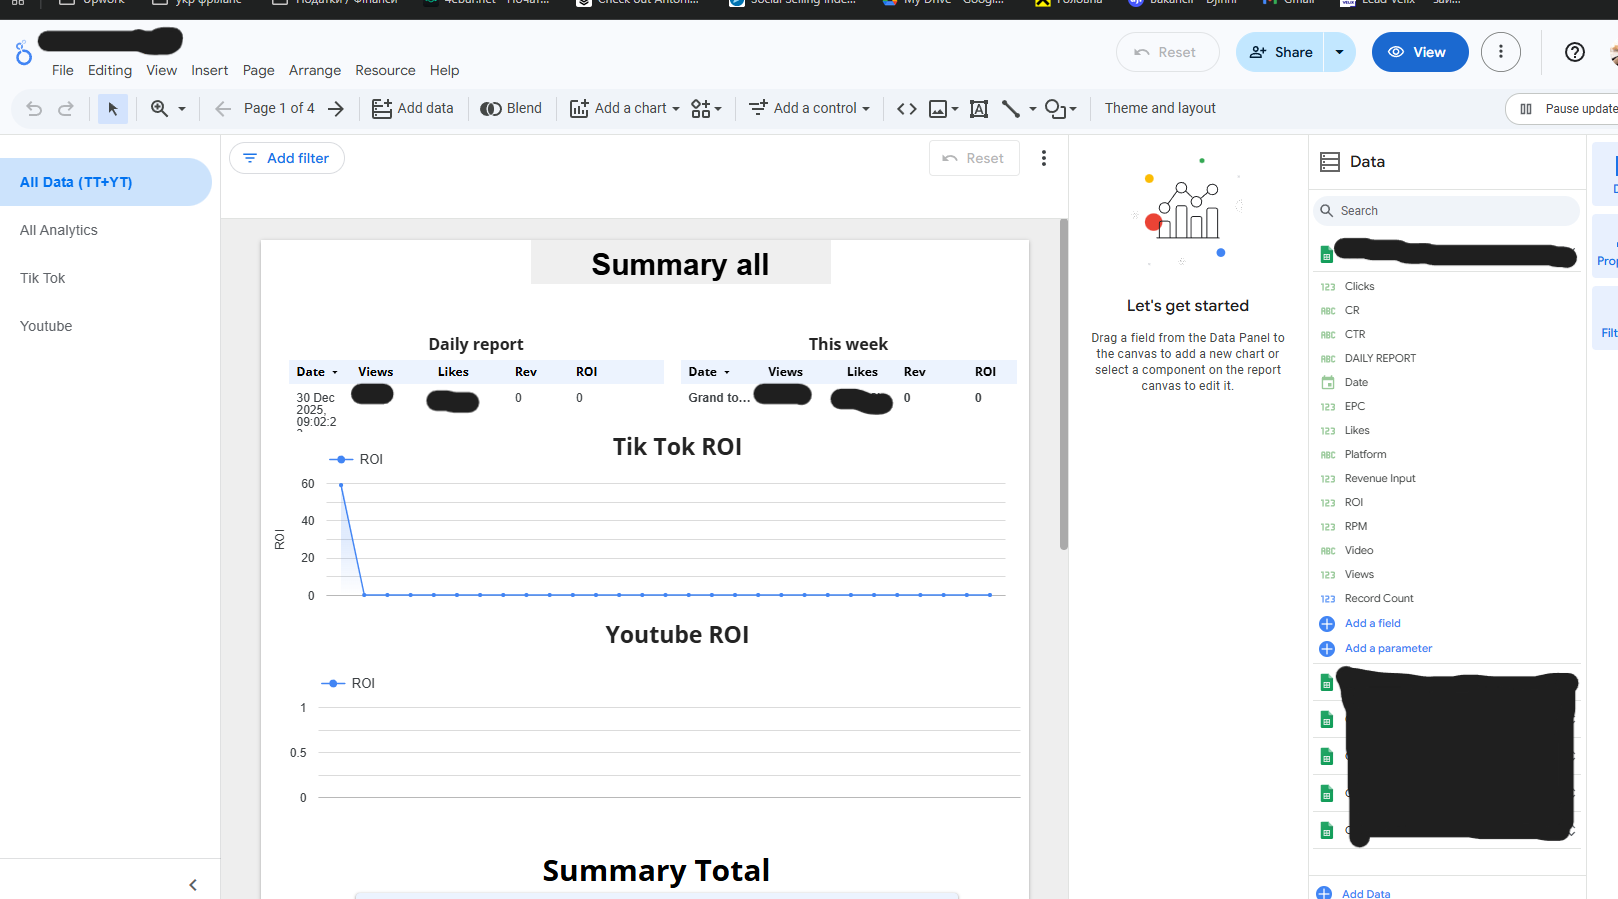
An interactive dashboard was built in Looker Studio with a single dataset that aggregates all metrics for TikTok and YouTube. On the “Summary all” screen, the following was implemented:
- a Daily report block with a table by date and key metrics (Views, Likes, Revenue, ROI);
- a This week block with aggregated values for the week;
- separate graphs for TikTok ROI and YouTube ROI, showing the change in return on investment over time.
Result
The marketer received a simple daily dashboard where the effectiveness of TikTok and YouTube content can be assessed in 10–20 seconds, quickly noticing any drop or increase in ROI, and making decisions about changing creatives and budgets without working in Excel or manual reports.
Solution
An interactive dashboard was built in Looker Studio with a single dataset that aggregates all metrics for TikTok and YouTube. On the “Summary all” screen, the following was implemented:
- a Daily report block with a table by date and key metrics (Views, Likes, Revenue, ROI);
- a This week block with aggregated values for the week;
- separate graphs for TikTok ROI and YouTube ROI, showing the change in return on investment over time.
Result
The marketer received a simple daily dashboard where the effectiveness of TikTok and YouTube content can be assessed in 10–20 seconds, quickly noticing any drop or increase in ROI, and making decisions about changing creatives and budgets without working in Excel or manual reports.