Visualization and Statistics
Visualization and statistics of the work of the machinery in production.
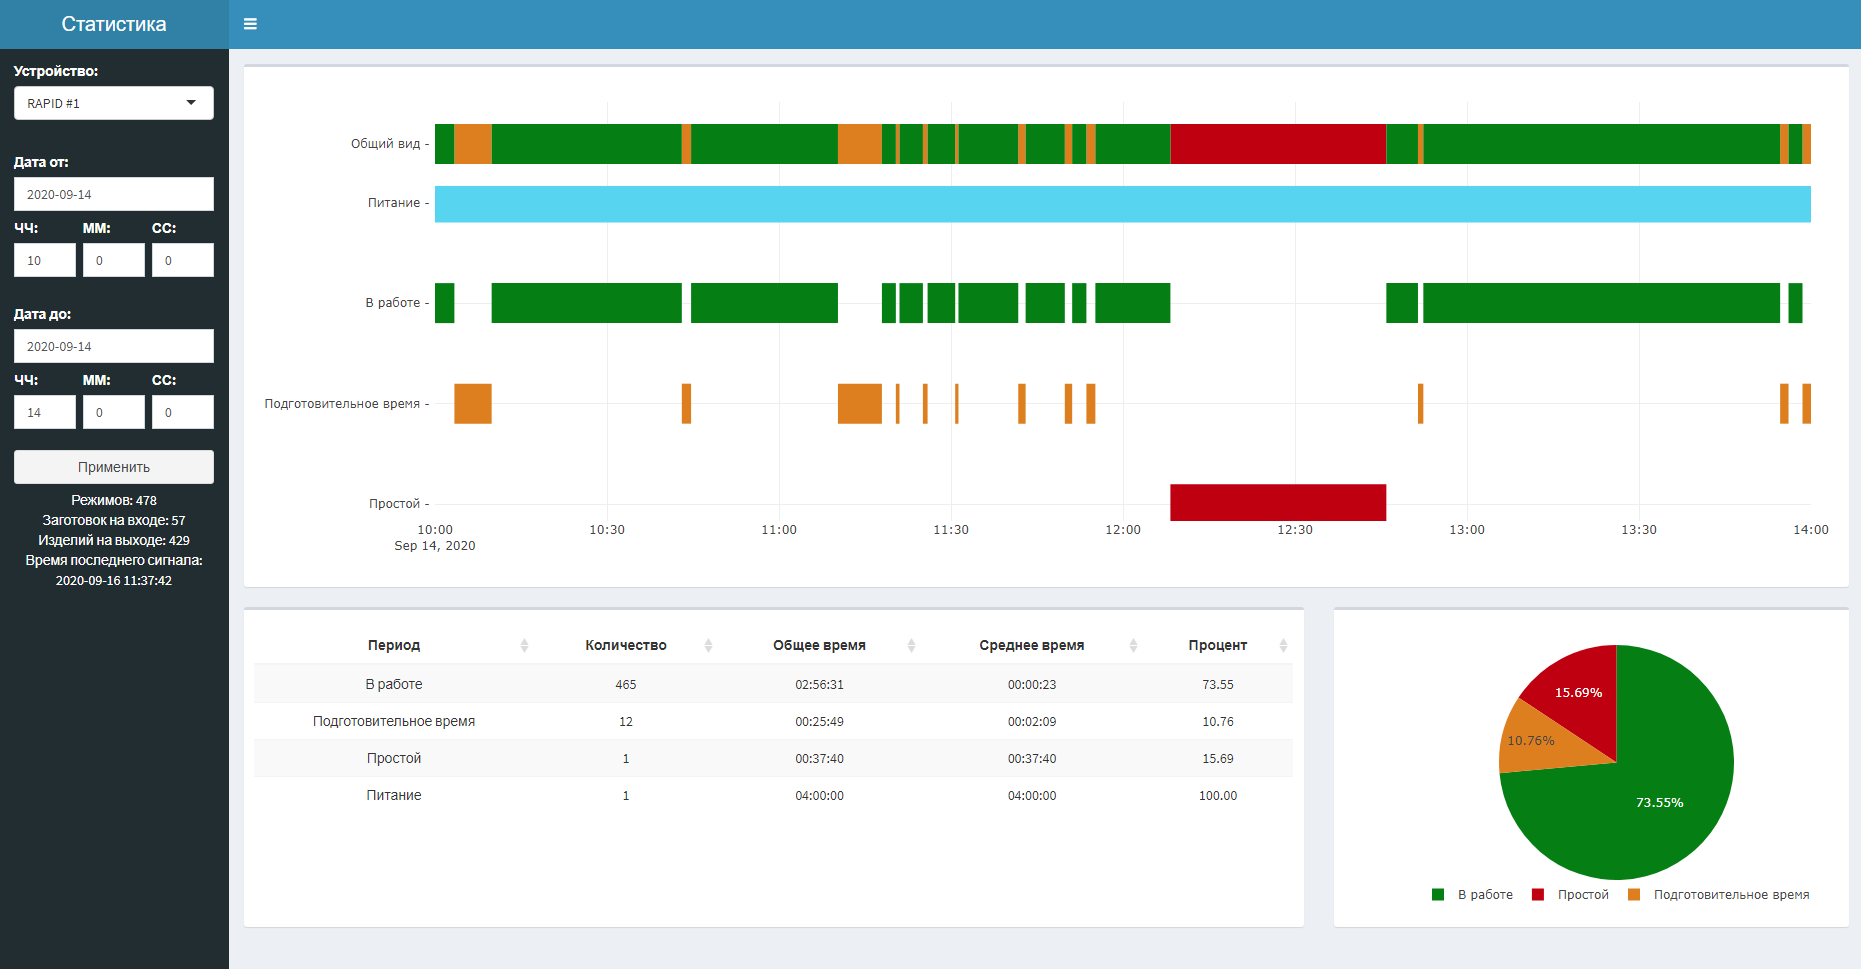
Realised on R using shiny + plotly.
In the BD on MS SQL Server, data about the state of the devices are recorded every second.
It determines the time intervals for each type of device, it is considered statistics and the time line is neglected.
#R #Shiny #mssql #visualisation #statistics
Realised on R using shiny + plotly.
In the BD on MS SQL Server, data about the state of the devices are recorded every second.
It determines the time intervals for each type of device, it is considered statistics and the time line is neglected.
#R #Shiny #mssql #visualisation #statistics
| |
Vladislav Tischenko
 Zaporizhzhia 13 0 Zaporizhzhia 13 0
|
12 Safes completed
On the service 9 years