Web interface for Circular Economy
Web Programming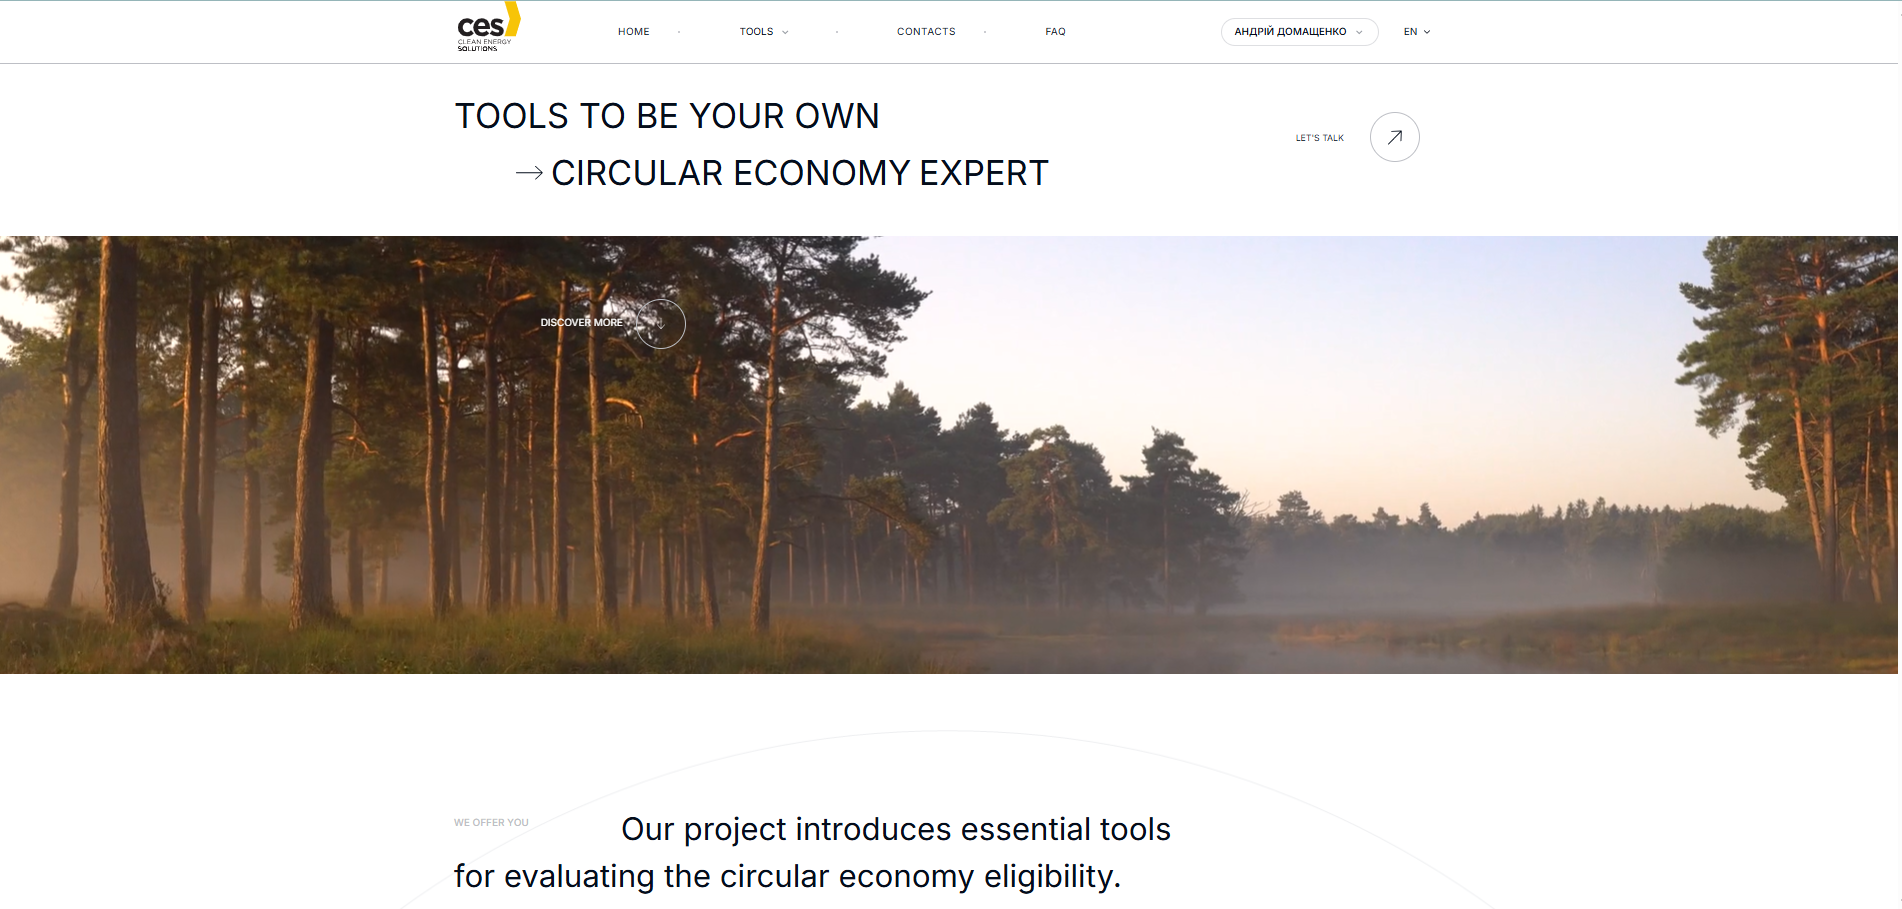
Developed the frontend part as a Next.js (React) web application, which acts as a client to the backend: displays data, builds charts, guides the user through scenarios/forms, and delivers results in the form of reports (including PDF). The stack is tailored for tasks involving “many UIs, many states, much analytics” — without lags and without pain.
Technologies and libraries (used)
Next.js 14 + React 18 — the foundation of the SPA/SSR application, standard scripts dev/build/start/lint.
UI/Design System:
Chakra UI (+ emotion/*) for quick assembly of a neat interface and components.
PrimeReact for ready-made complex components (tables/forms/widgets).
API layer: Axios for requests to the backend + centralized handling of responses/errors.
State management: Zustand for state management (lightweight, fast, without “Redux epic”).
Multilingualism (i18n): i18next + next-i18next + react-i18next, as well as utilities for determining/matching locale.
Visualization and analytics:
Chart.js + react-chartjs-2 + chartjs-plugin-datalabels for charts and value labels.
CanvasJS React Charts as an additional tool for charts/diagrams.
PDF / Export