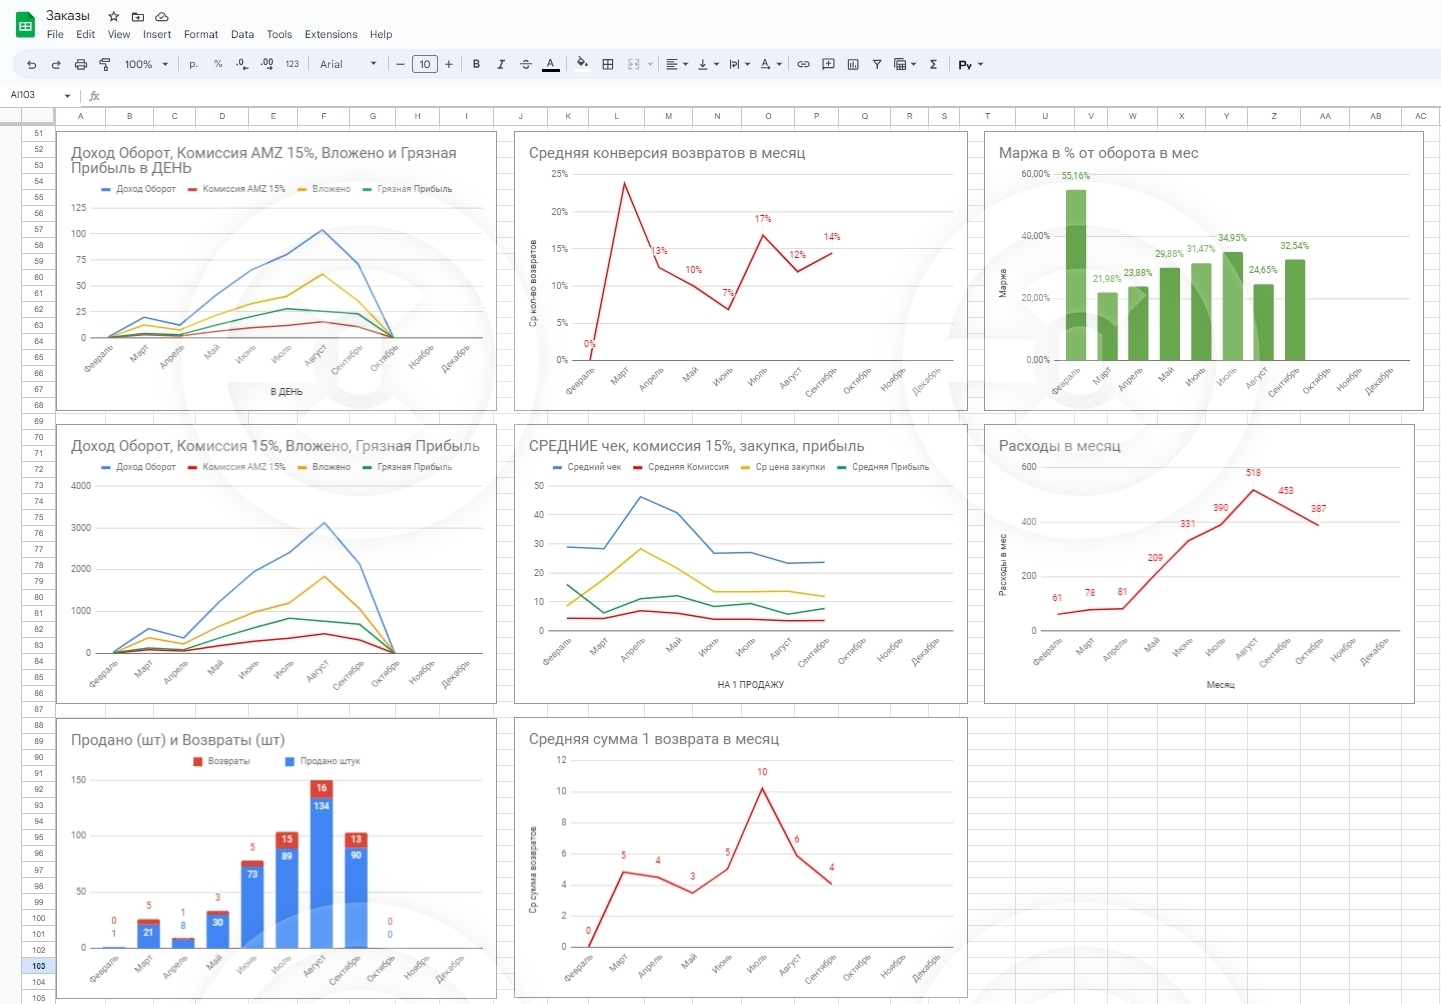
I apply an example of analytical graphs in Google tables for the online store on Amazon
HTTPS://docs.google.com/spreadsheets/d/1aHDGBGUXoUfKjqhGF4QXfMXbsPFqTm8auUOXASniMXg/edit#gid=1178306328
I can create the same analysis for your business.
For this we need you with us.
1 .Find out where we will get the data from.
2ndIn what form these data are now collected and stored
ThreeHow these data are collected and stored now (manual or automatically)
4 .How we plan to collect and store data for further use (manual or automatically)
and 5.Agreement of a single data storage format for further processing
6 .Configure data loading to a single templated report
7 .Adjust what graphs and in what format you need to analyze and efficient business management
8 .Set up the graphs
The 9.Recording a student video how to use and work with these data correctly
The 10.Training and Answer Questions
Cost of 500 EUR
Period of 2 to 4 weeks