Create an interactive dashboard with KPI indicators
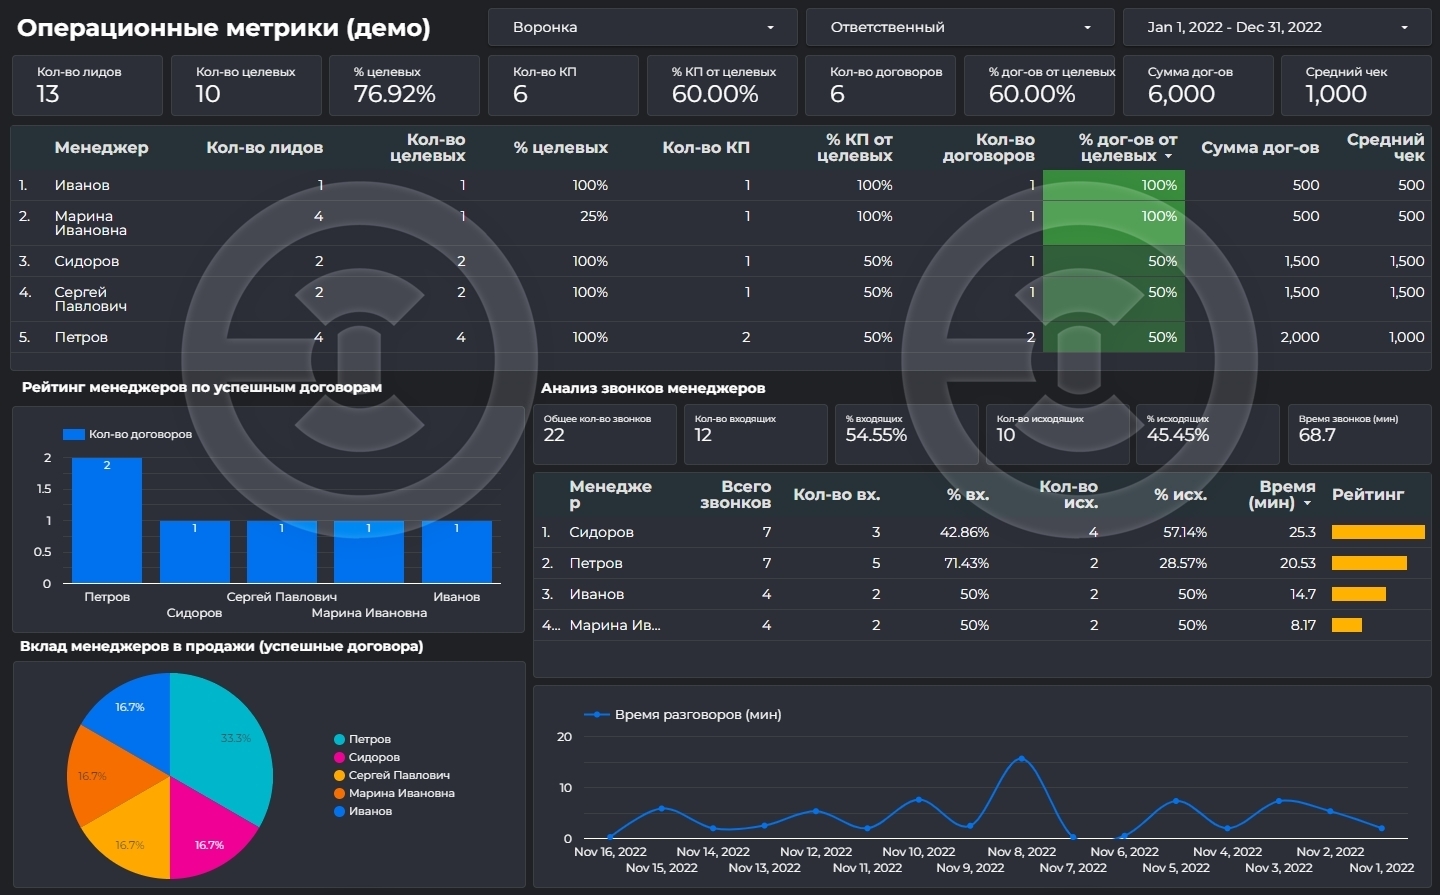
The example of this dashboard look at the link.
HTTPS://lookerstudio.google.com/u/0/reporting/80d98c61-f8f6-4646-90cd-a8c28a942fc1/page/hiD2C
Plan of work
1 .Hold 5 (or more) meetings (for 1-1,5 hours) to identify, fix, harmonize all the KPI indicators you need to analyze and effectively manage your business
2ndCoordinate data sources for each KPI indicator.Where should we get these data or in what form they are calculated?
ThreeClassification / grouping of all KPI indicators by different dashboards
4 .Compatibility of the visual display format of each KPI group on the dashboard
and 5.Coordination of TZ (Technical Task) for the Development of All Dashboards
6 .Evaluation of the TZ (Technical Task) on the Development of All Dashboards
7 .Presentation of the KP (commercial offer) with development deadlines and cost.Answers to Questions
8 .Agreement of start date of work
Phases of Payment
1 .Creation of TZ (Technical Task) for Development
Cost of 500 EUR
Deadlines from 2 to 4 weeks
2ndThe cost of the development of the dashboard depends on the agreed TZ (technical task)
Value range from 2 000 to 5 000 EUR
Deadlines from 1 to 2 months