Efficiency Analysis of Online Advertising with Looker Studio
Data Processing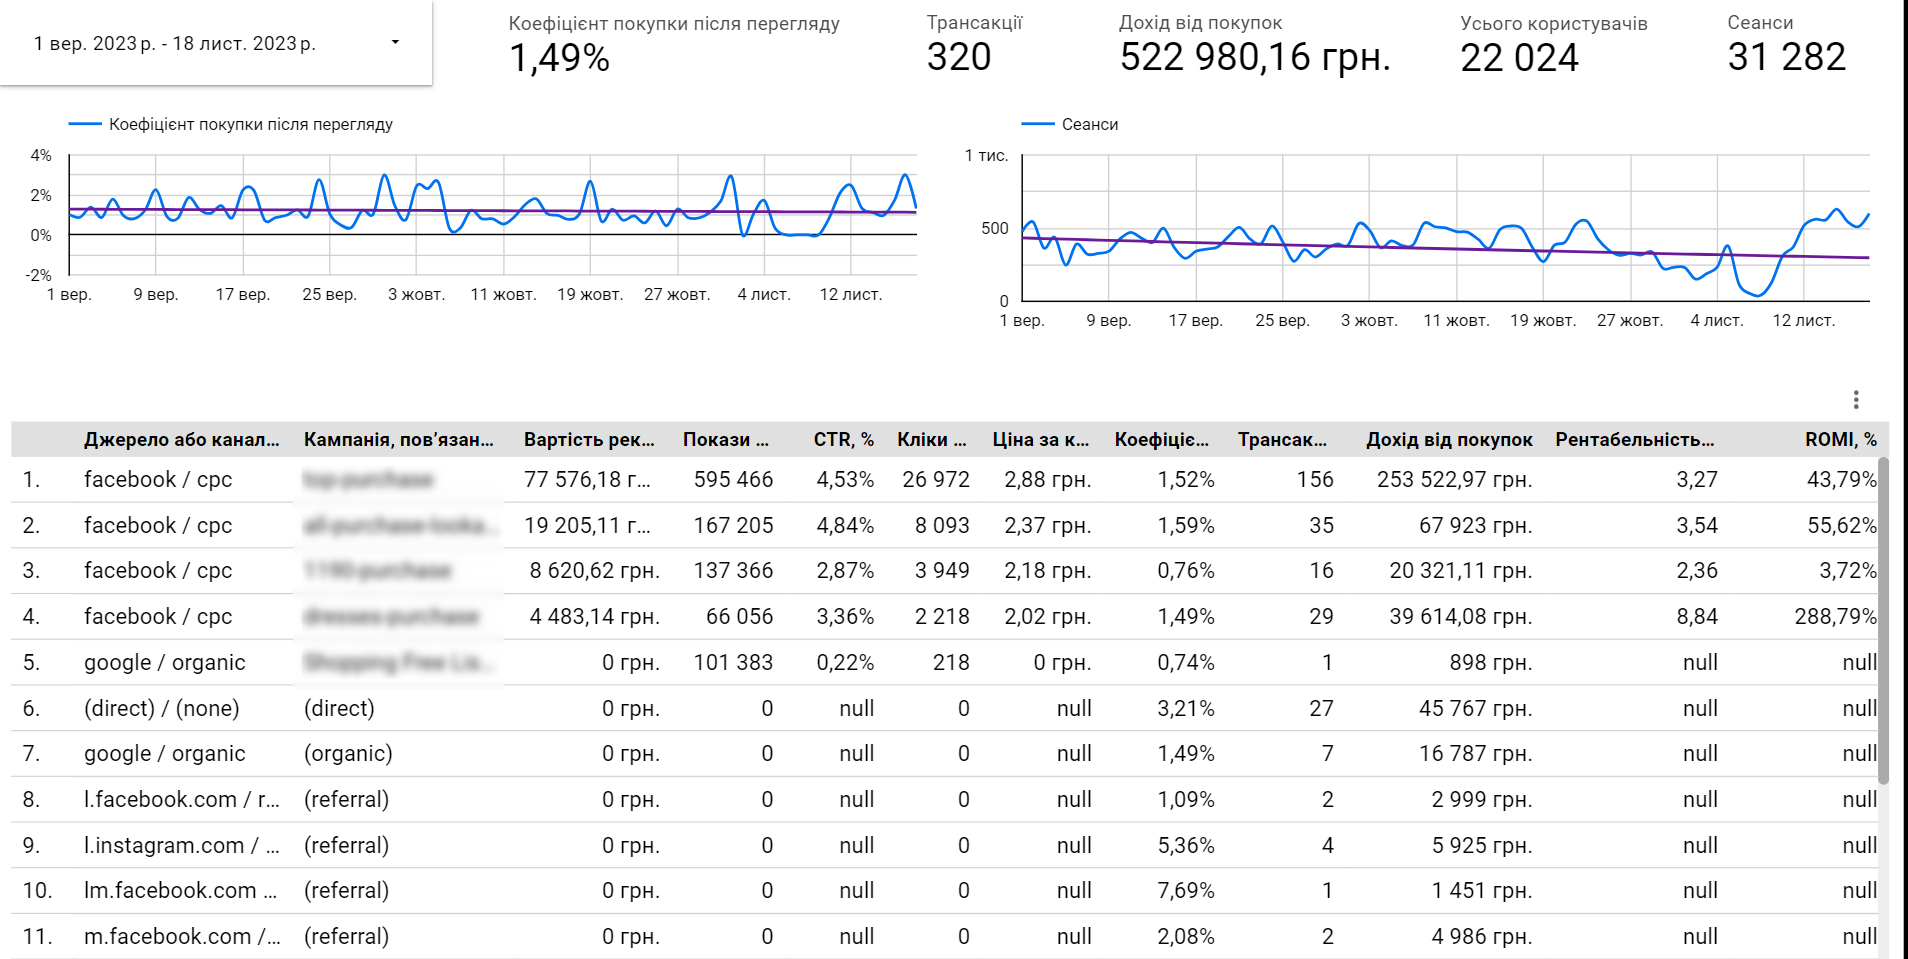
The task was to create a Looker Studio report to find out how successful specific sources/channels and advertising campaigns are, and what impact they have on the business.What was done:
1 .Sources and Companies Analysis: The report presents a table with a list of sources and advertising campaigns taking into account such indicators as the advertising cost, the number of shows, the CTR, the number of clicks, the CPC, the transaction coefficient, the number of transactions, the income, the profitability of advertising costs and the ROMI.ROMI and profitability of advertising costs may be similar, but they provide a clear insight of the efficiency of advertising costs and achieving profitability.The 2ndOverall results: Overall figures for a certain period of time are also presented, including the purchase rate after review, the number of transactions, the income from purchases, the total number of users and sessions.This allows you to evaluate the overall result in one or another period of time.3 .Graphic analysis: The report has created two graphs that reflect the dynamics of results and the growth or decrease trends of results over a given period.This helps to react timely to changes, to determine the specific time when results began to change, and to improve advertising strategies.Thanks to this report, you can easily track the results of the advertising activity and make reasonable decisions to improve its effectiveness.
1 .Sources and Companies Analysis: The report presents a table with a list of sources and advertising campaigns taking into account such indicators as the advertising cost, the number of shows, the CTR, the number of clicks, the CPC, the transaction coefficient, the number of transactions, the income, the profitability of advertising costs and the ROMI.ROMI and profitability of advertising costs may be similar, but they provide a clear insight of the efficiency of advertising costs and achieving profitability.The 2ndOverall results: Overall figures for a certain period of time are also presented, including the purchase rate after review, the number of transactions, the income from purchases, the total number of users and sessions.This allows you to evaluate the overall result in one or another period of time.3 .Graphic analysis: The report has created two graphs that reflect the dynamics of results and the growth or decrease trends of results over a given period.This helps to react timely to changes, to determine the specific time when results began to change, and to improve advertising strategies.Thanks to this report, you can easily track the results of the advertising activity and make reasonable decisions to improve its effectiveness.