Metrics 2022 — Subscription Business Dashboard (Tableau)
Databases & SQL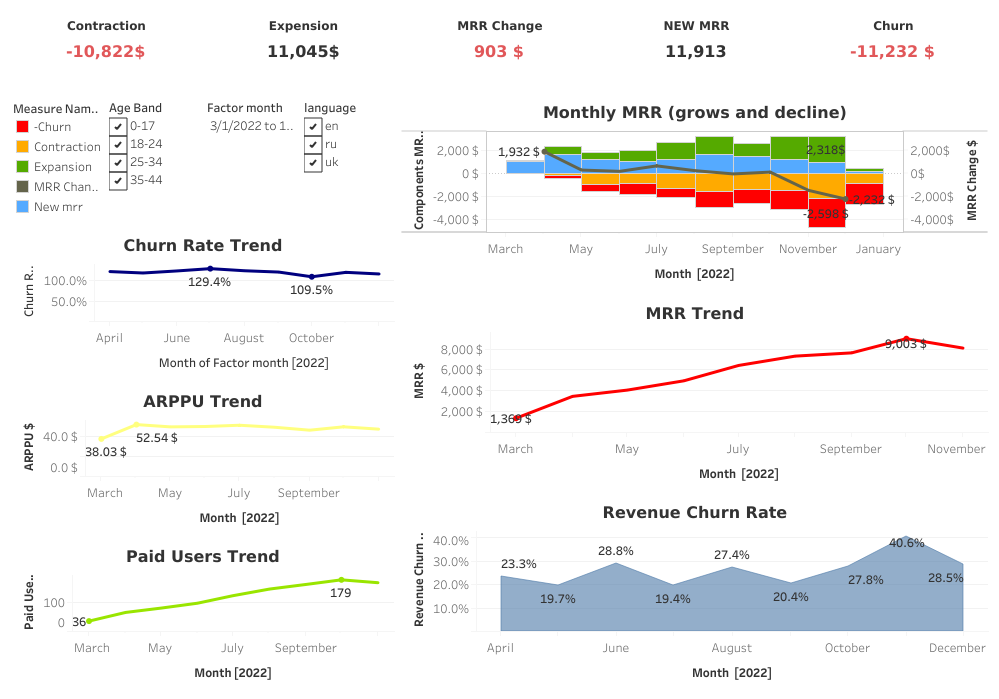
Interactive dashboard created in Tableau that displays key business metrics for 2022:
MRR (Monthly Recurring Revenue) — monthly revenue from subscriptions
Churn / Expansion / Contraction / New MRR — dynamics of customer growth and churn
ARPPU (Average Revenue Per Paying User)
Paid Users Trend
Revenue Churn Rate
Key features:
Filters by age groups, language, and period
Comparison of MRR growth and contraction metrics
Visualization of trends by month in the form of line and combined charts
Analytics of MRR changes showing positive (Expansion) and negative (Churn, Contraction) impacts
Tools:
Tableau, Google Sheets, SQL (data preprocessing)
Result:
The dashboard allows for quick assessment of revenue stability, tracking customer retention metrics, and making decisions on optimizing the subscription business model.