Statistical funnel, correlation
Data Processing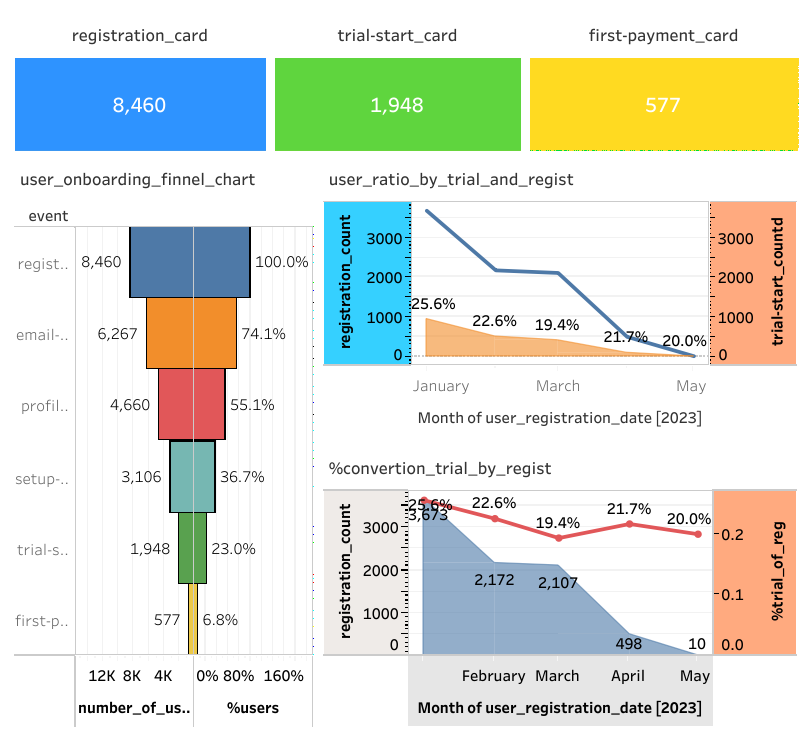
The goal was to identify the number of users at each stage (from registration to the first purchase), calculate correlations of each step to the initial one, and create clear visual maps for every stage. Result: A user activity funnel, stage-by-stage visual maps, and charts with calculations were built. It was revealed that 6.8% of users reached the purchase stage, while 19–23% on average proceeded to the trial start.