User Onboarding, Conversion & Retention Analysis - US
Databases & SQL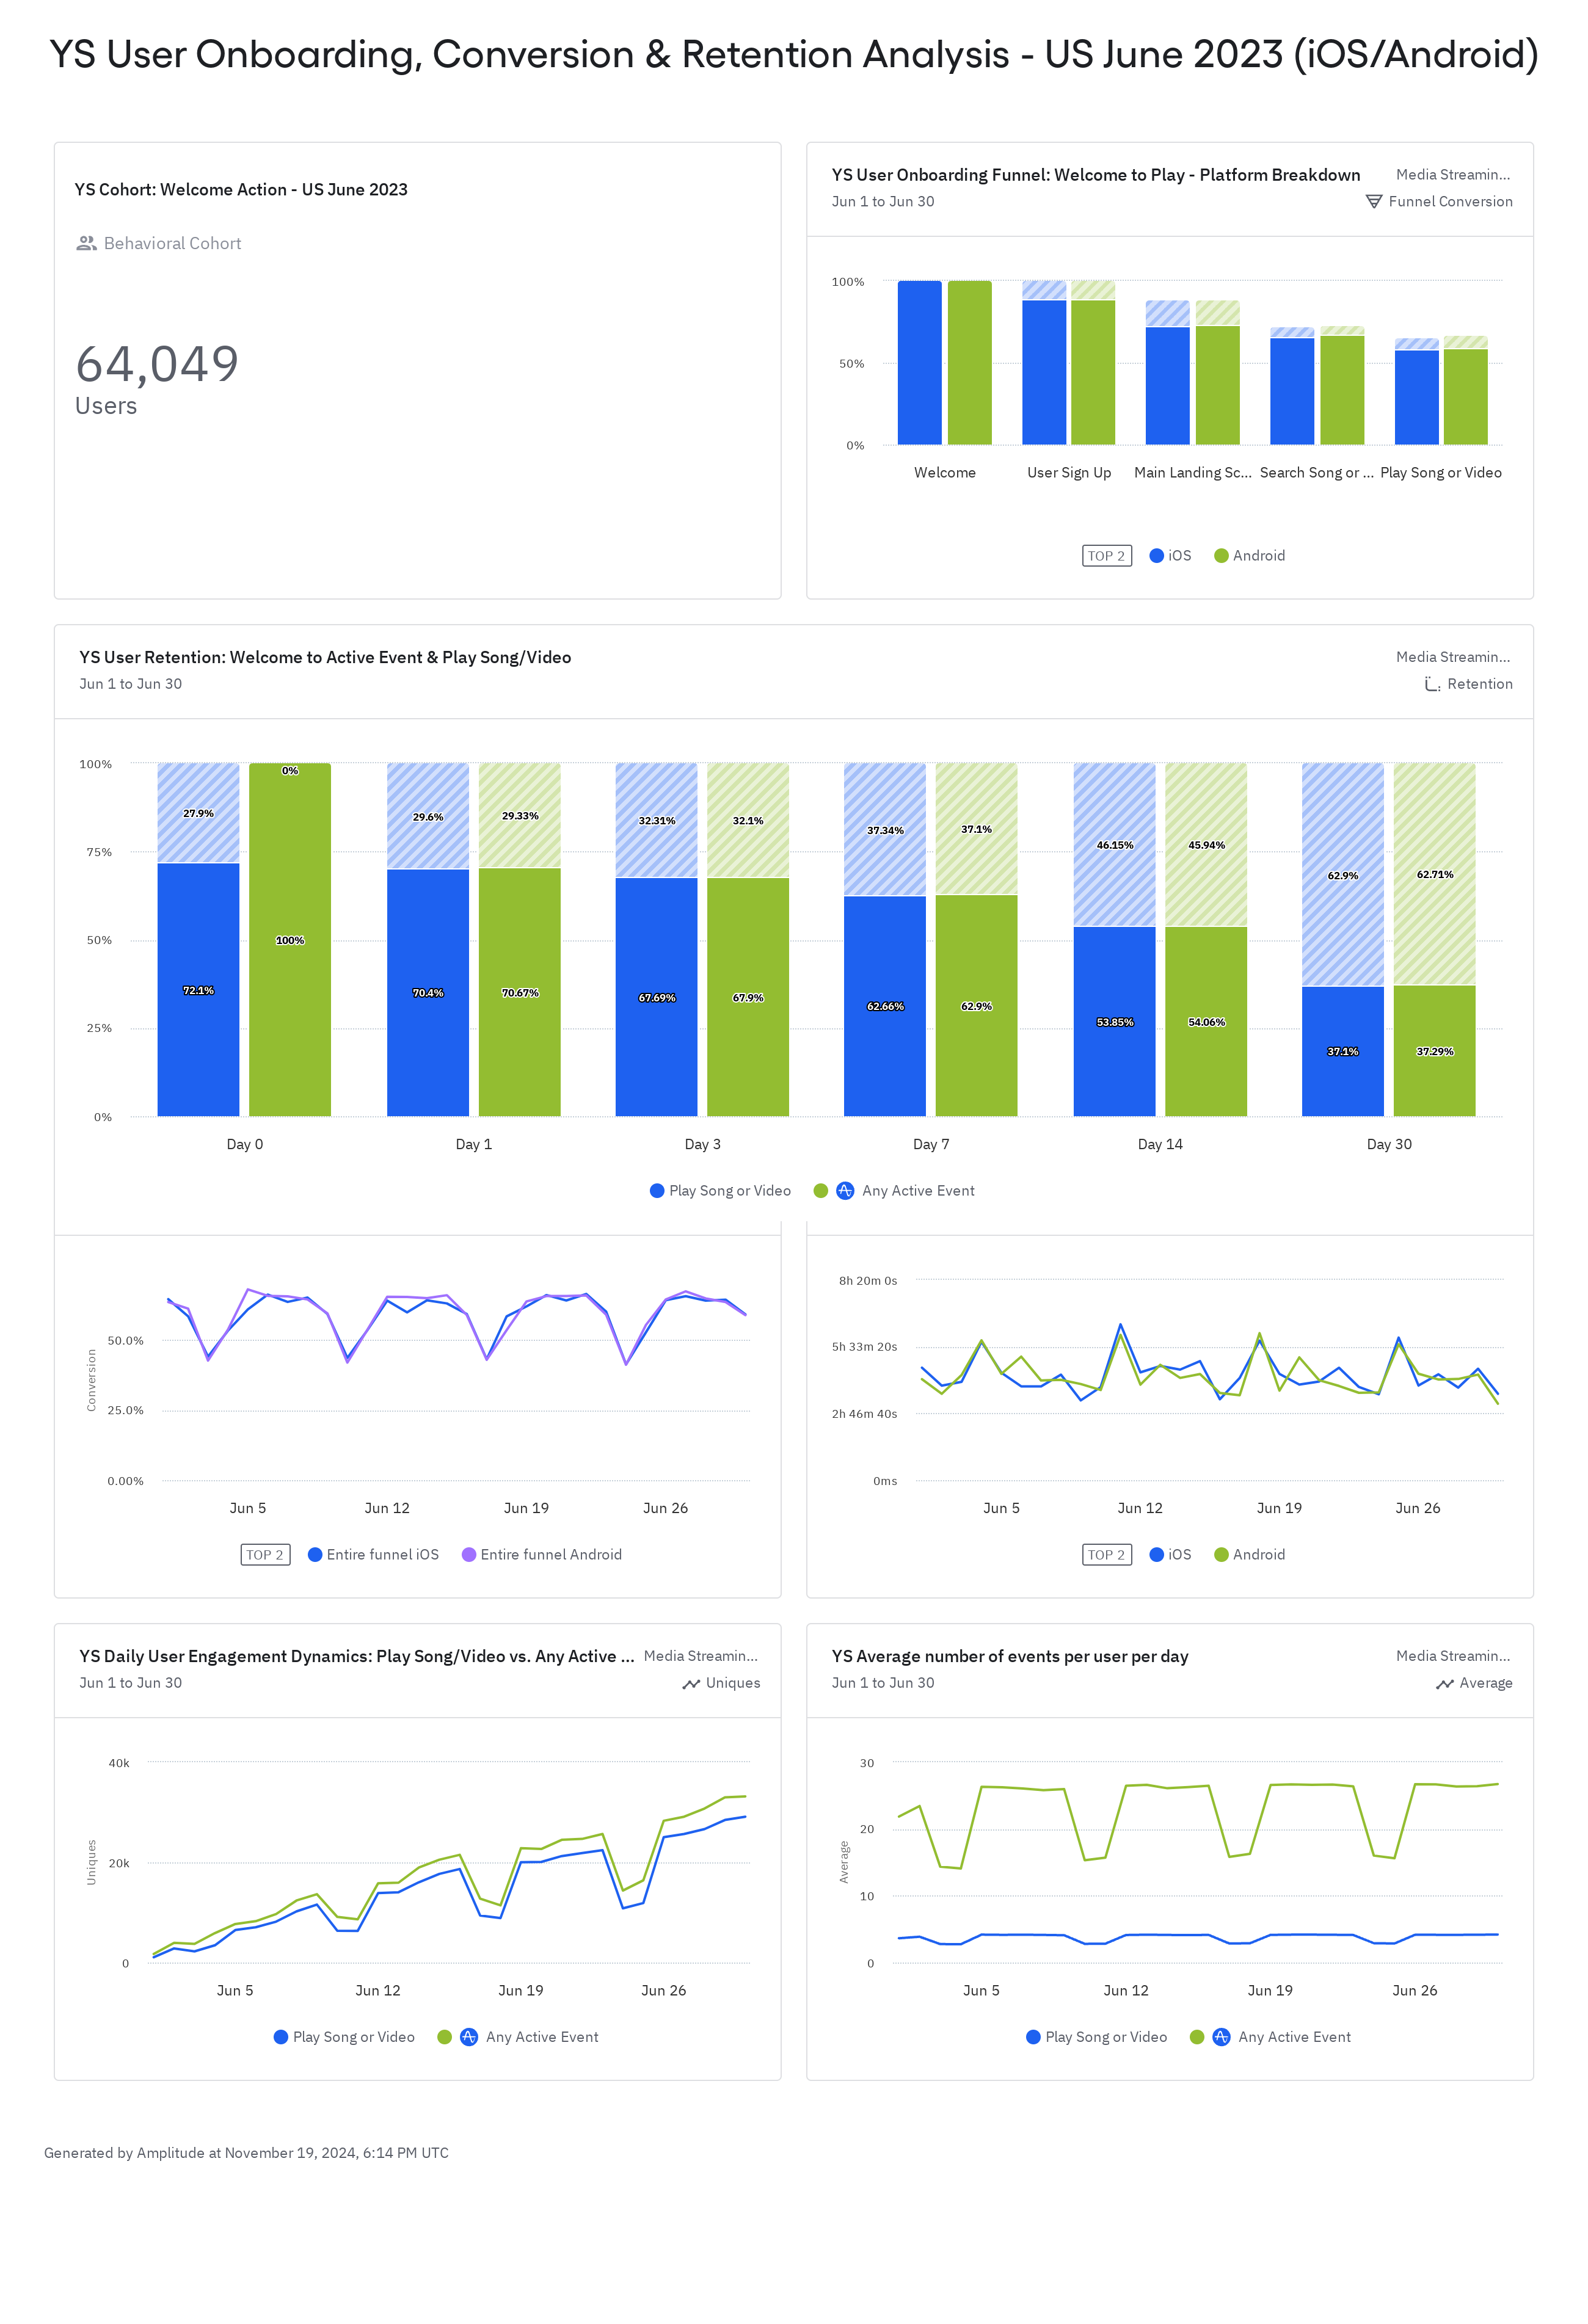
I developed a cohort-based dashboard in Amplitude to analyze user onboarding, conversion, and retention for users in the US who performed the "Welcome" action in June 2023. The analysis focuses on both iOS and Android platforms, providing insights into how users progress through the onboarding funnel and engage with key app features. Key Metrics and Visualizations: - Cohort: Welcome Action - US June 2023: Tracks the number of users in the US who completed the "Welcome" action during June 2023, segmented by platform (iOS/Android). - User Onboarding Funnel: Welcome to Play - Platform Breakdown: Shows the conversion rate from completing the welcome action to the first in-app activity (e.g., Play Song/Video), broken down by platform. - User Retention: Welcome to Active Event & Play Song/Video: Analyzes retention by tracking users who engaged with core events like Play Song/Video after completing the "Welcome" action. - Daily Conversion Rate by Platform: Monitors daily conversion rates from onboarding to key user actions, segmented by platform (iOS/Android). - Daily Onboarding Duration by Platform: Measures the time spent by users in the onboarding process, segmented by platform, to assess the efficiency of the flow. - User Engagement Dynamics: Play Song/Video vs. Active Events: Compares user engagement between key actions (e.g., Play Song/Video vs. other events), providing insights into user preferences. This cohort analysis helped identify key drop-off points and areas for optimization in the user journey, enabling data-driven insights for improving user retention and conversion. By segmenting the data by platform and analyzing engagement patterns, I was able to draw actionable conclusions to enhance the user experience and increase long-term user retention.I developed a cohort-based dashboard in Amplitude to analyze user onboarding, conversion, and retention for users in the US who performed the "Welcome" action in June 2023. The analysis focuses on both iOS and Android platforms, providing insights into how users progress through the onboarding funnel and engage with key app features. Key Metrics and Visualizations: - Cohort: Welcome Action - US June 2023: Tracks the number of users in the US who completed the "Welcome" action during June 2023, segmented by platform (iOS/Android). - User Onboarding Funnel: Welcome to Play - Platform Breakdown: Shows the conversion rate from completing the welcome action to the first in-app activity (e.g., Play Song/Video), broken down by platform. - User Retention: Welcome to Active Event & Play Song/Video: Analyzes retention by tracking users who engaged with core events like Play Song/Video after completing the "Welcome" action. - Daily Conversion Rate by Platform: Monitors daily conversion rates from onboarding to key user actions, segmented by platform (iOS/Android). - Daily Onboarding Duration by Platform: Measures the time spent by users in the onboarding process, segmented by platform, to assess the efficiency of the flow. - User Engagement Dynamics: Play Song/Video vs. Active Events: Compares user engagement between key actions (e.g., Play Song/Video vs. other events), providing insights into user preferences. This cohort analysis helped identify key drop-off points and areas for optimization in the user journey, enabling data-driven insights for improving user retention and conversion. By segmenting the data by platform and analyzing engagement patterns, I was able to draw actionable conclusions to enhance the user experience and increase long-term user retention.