Sales and Profit Analysis in Power BI
As part of a business intelligence case study, I created a multi-page interactive report using Power BI to help a global distributor identify key drivers of profitability and optimize sales strategies.
Dataset: Superstore (sales data across multiple years, regions, categories)
Key components:
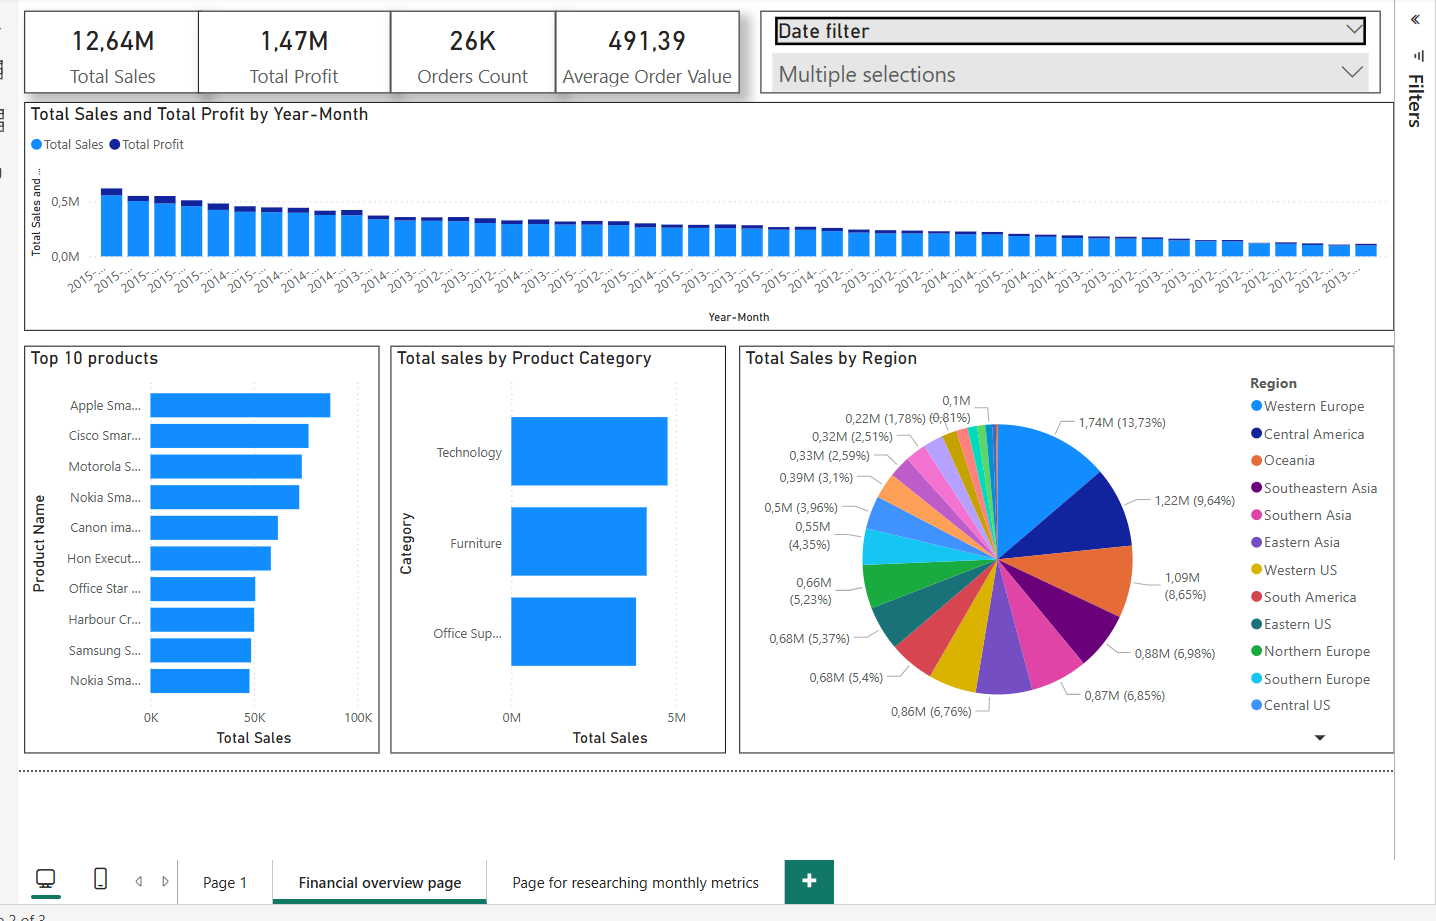
Financial Overview Dashboard: Total Sales, Profit, Average Order Value, Top Products & Regions
Monthly Trends & Year-over-Year (YoY) Analysis: Time series and seasonal patterns with dynamic filters
Discount Impact Analysis: Effect of discount levels on profitability and recommendations
Category & Regional Analysis: Profit and sales distribution across product categories and global regions
Drillthrough View: Detailed order breakdown by filters (region, discount, etc.)
Tools & Skills:
Power BI Desktop, DAX, data modeling (star schema), calculated measures, slicers, drillthrough, date tables
The project helped uncover:
Most profitable categories and customer segments
Losses caused by excessive discounting
Regional patterns in sales and margin performance
Full report includes Power BI Desktop file, published report in Power BI Service, and a presentation in PowerPoint.
Dataset: Superstore (sales data across multiple years, regions, categories)
Key components:
Financial Overview Dashboard: Total Sales, Profit, Average Order Value, Top Products & Regions
Monthly Trends & Year-over-Year (YoY) Analysis: Time series and seasonal patterns with dynamic filters
Discount Impact Analysis: Effect of discount levels on profitability and recommendations
Category & Regional Analysis: Profit and sales distribution across product categories and global regions
Drillthrough View: Detailed order breakdown by filters (region, discount, etc.)
Tools & Skills:
Power BI Desktop, DAX, data modeling (star schema), calculated measures, slicers, drillthrough, date tables
The project helped uncover:
Most profitable categories and customer segments
Losses caused by excessive discounting
Regional patterns in sales and margin performance
Full report includes Power BI Desktop file, published report in Power BI Service, and a presentation in PowerPoint.
 Podolsk