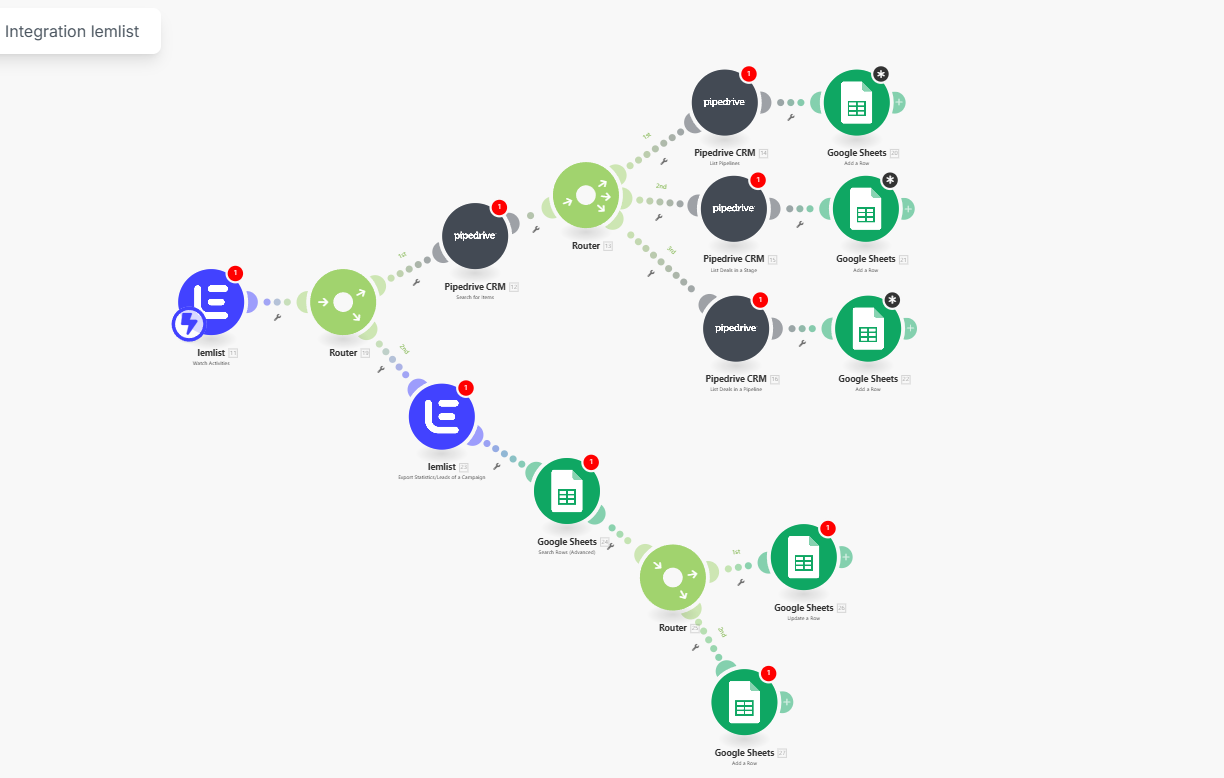
1. Event Source: Lemlist - Router
Automation starts from Lemlist:
- the "Watch Activities" module tracks events in email campaigns (sending, opening, clicks, replies, unsubscribes);
- each event goes to the Router, which distributes it into two main branches:
- synchronization of leads/deals through Pipedrive;
- updating campaign statistics in Google Sheets.
Value: the script reacts specifically to the actions of email recipients, rather than working on a cron schedule "blindly."
2. Branch 1: Lemlist - Pipedrive - Google Sheets (deals)
At the top of the script, a chain of several Pipedrive nodes and Google Sheets is built:
- the first Pipedrive "Search for Items" finds the necessary deals or contacts using email/ID from Lemlist;
- subsequent Pipedrive modules receive details: funnel, stage, deal name, responsible manager;
- the Router divides this data into 2–3 branches based on logic: for example, "deals in active stage," "deals in success," "closed/lost";
- for each branch, a separate Google Sheets module "Add a Row" creates a row in the corresponding sheet (for example: Active Deals, Won Deals, Lost Deals), where key fields are recorded: Lemlist campaign, email, status, stage, date, manager.
Value: you get a live funnel for outbound campaigns in the form of tabular reports, where for each contact you can see both the deal status in Pipedrive and activity in Lemlist.
3. Branch 2: Lemlist - Google Sheets - Router - Google Sheets (campaign statistics)
The lower part of the script is responsible for aggregated statistics:
- the Lemlist module "Export Statistics / Leads of a Campaign" uploads metrics for a specific campaign (sent, opened, replies, positive/negative replies, etc.);
- Google Sheets "Search Rows (Advanced)" checks if there is already a record for this campaign/lead in the table;
- the Router analyzes the search result:
- if a row is found — the Google Sheets branch "Update a Row" updates the statistics (for example, increments the number of opens/replies, updates the last activity);
- if a row is not found — the second Google Sheets branch "Add a Row" creates a new record with all metrics and links to the campaign and manager.
Value: a dashboard for Lemlist campaigns is formed in one table: conversions, openings, replies, which can be immediately used for analytics or connected to BI.
4. Role of Router nodes
Router nodes in the center of the script act as the "brain" of routing:
- they separate the flow of events by type (reply, click, unsubscribe, bounce);
- they send different types of events to different tables/sheets or to different update branches.
- For example, customer replies can go to a separate sheet "Replies," while clicks are only for CTR analytics, without creating deals.
5. What the business receives
A single contour: Lemlist - Pipedrive - Google Sheets work as an interconnected system, without manual CSV export.
Relevance: deal statuses, lead activity, and campaign statistics are updated automatically with each event, rather than once a week.
Transparent analytics: in Google Sheets, it is clear which campaigns yield the most replies, at which stages leads "get stuck," and which managers close deals after outbound emails.