Development and implementation of an intelligent planning system for the construction of a multi-story residential complex ("La Familia", 9 floors, 150 apartments). The system automatically transforms a list of 80+ engineering tasks into a visual Gantt chart highlighting the critical path.
What "pain" are we solving?
In large construction projects, manually updating the Gantt chart with the slightest shift in deadlines takes hours. Without visualization, the manager cannot see the "bottleneck" — the very task that can halt the entire project.
What has been implemented (Technical part):
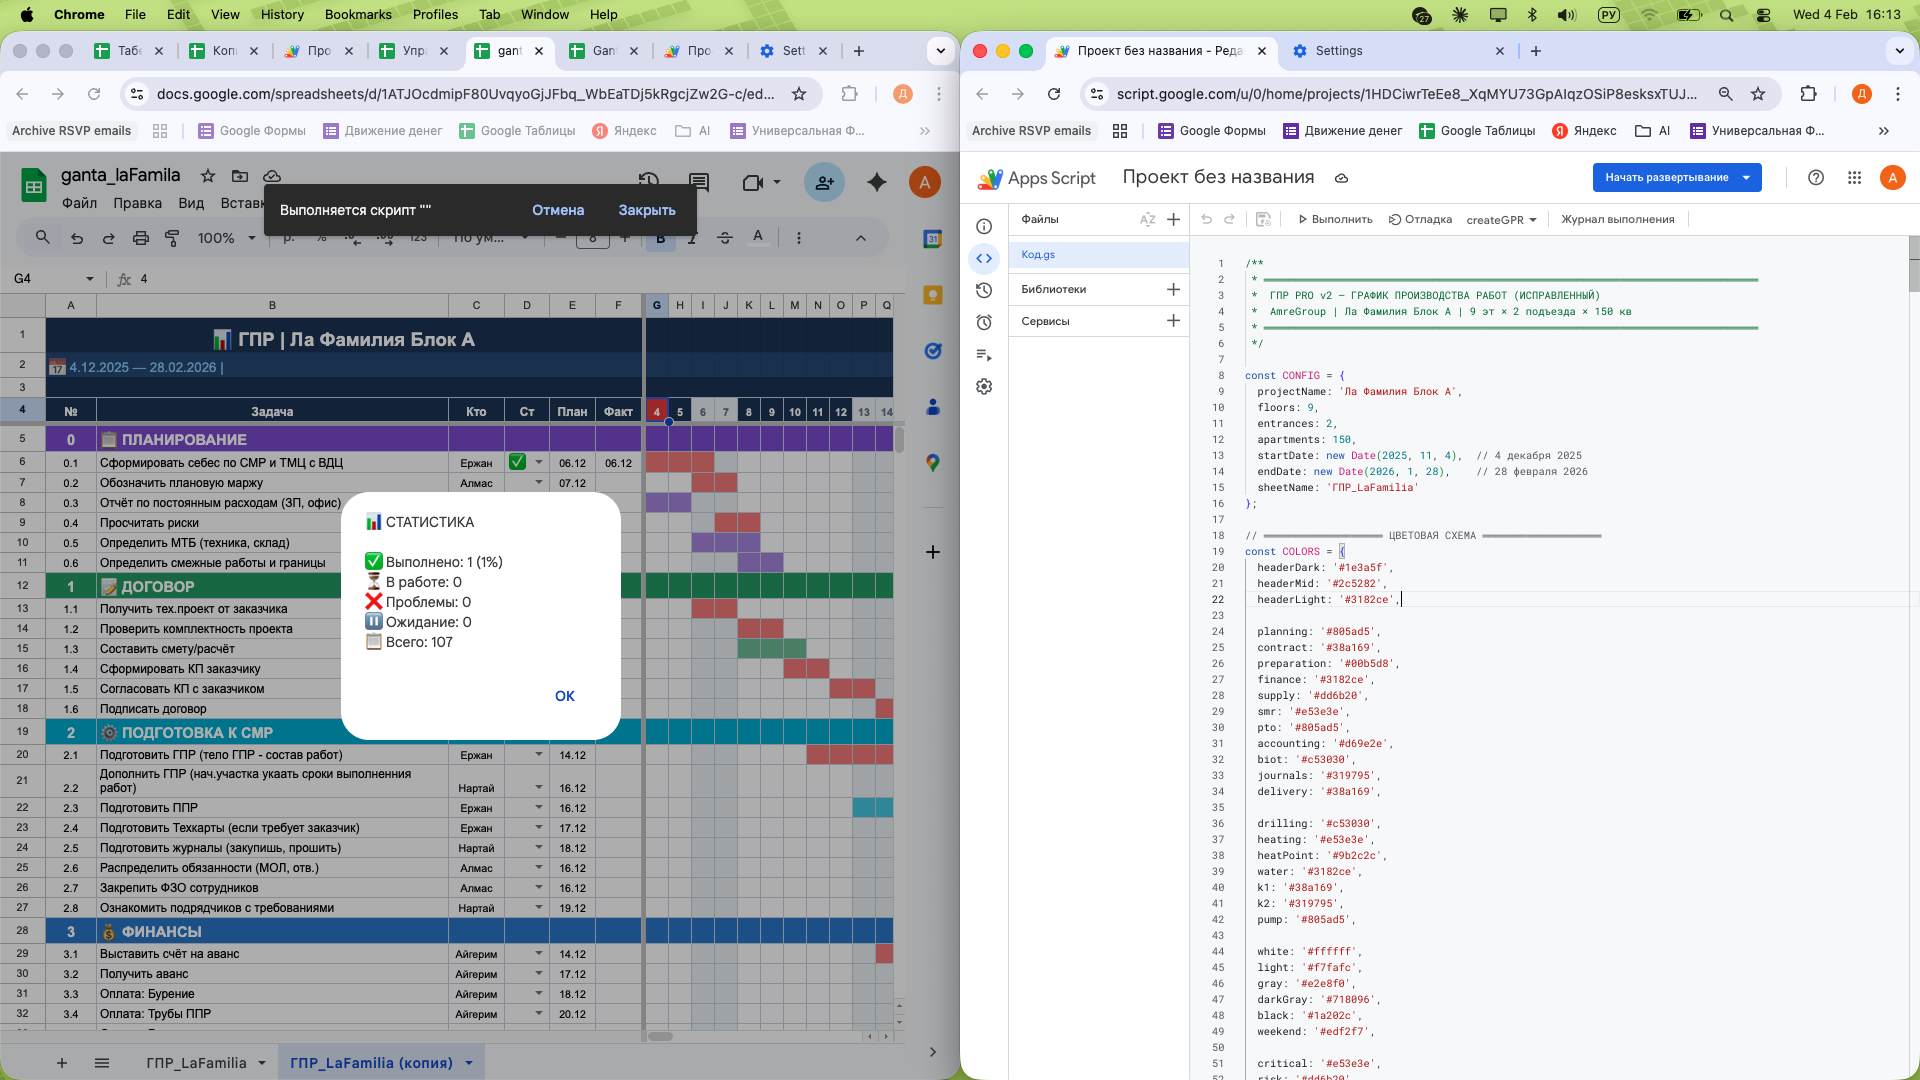
Automatic generation (Engine): A custom script written in JavaScript (GAS) that builds a calendar grid in seconds, highlighting weekends and holidays.
Smart visualization: The script automatically draws task "bars," taking into account their duration and technological dependencies.
Critical path (Critical Path Method): Automatic highlighting of key tasks in red. If a task on the critical path shifts — this is an SOS signal for management.
Interactive Dashboard:
"Statistics" button: instant calculation of the % completion of the project and the number of problem areas.
"Today" button: a red line on the chart showing actual progress relative to the plan.
Legend: a custom HTML window with descriptions of the areas of responsibility of departments (PTO, Supply, Construction, Accounting).
Technical stack:
Google Apps Script (JavaScript): Logic for drawing, working with date objects, and dynamic formatting.
HTML/CSS: Creating user interfaces and modal windows within tables.
Excel/Sheets Pro: Using complex algorithms to calculate intersections and deadlines.
Result for the business:
Speed: The creation and updating of the Gantt chart have been reduced from 6-8 hours to 10 seconds.
Control: The manager sees not just a to-do list, but a living organism of the project, where all risks are highlighted.
Synchronization: 11 departments work in a unified rhythm, seeing each other's deadlines in real time.
What "pain" are we solving?
In large construction projects, manually updating the Gantt chart with the slightest shift in deadlines takes hours. Without visualization, the manager cannot see the "bottleneck" — the very task that can halt the entire project.
What has been implemented (Technical part):
Automatic generation (Engine): A custom script written in JavaScript (GAS) that builds a calendar grid in seconds, highlighting weekends and holidays.
Smart visualization: The script automatically draws task "bars," taking into account their duration and technological dependencies.
Critical path (Critical Path Method): Automatic highlighting of key tasks in red. If a task on the critical path shifts — this is an SOS signal for management.
Interactive Dashboard:
"Statistics" button: instant calculation of the % completion of the project and the number of problem areas.
"Today" button: a red line on the chart showing actual progress relative to the plan.
Legend: a custom HTML window with descriptions of the areas of responsibility of departments (PTO, Supply, Construction, Accounting).
Technical stack:
Google Apps Script (JavaScript): Logic for drawing, working with date objects, and dynamic formatting.
HTML/CSS: Creating user interfaces and modal windows within tables.
Excel/Sheets Pro: Using complex algorithms to calculate intersections and deadlines.
Result for the business:
Speed: The creation and updating of the Gantt chart have been reduced from 6-8 hours to 10 seconds.
Control: The manager sees not just a to-do list, but a living organism of the project, where all risks are highlighted.
Synchronization: 11 departments work in a unified rhythm, seeing each other's deadlines in real time.