Automated BI system for management/accounting of fixed assets, cash flow, balance sheet
Data Parsing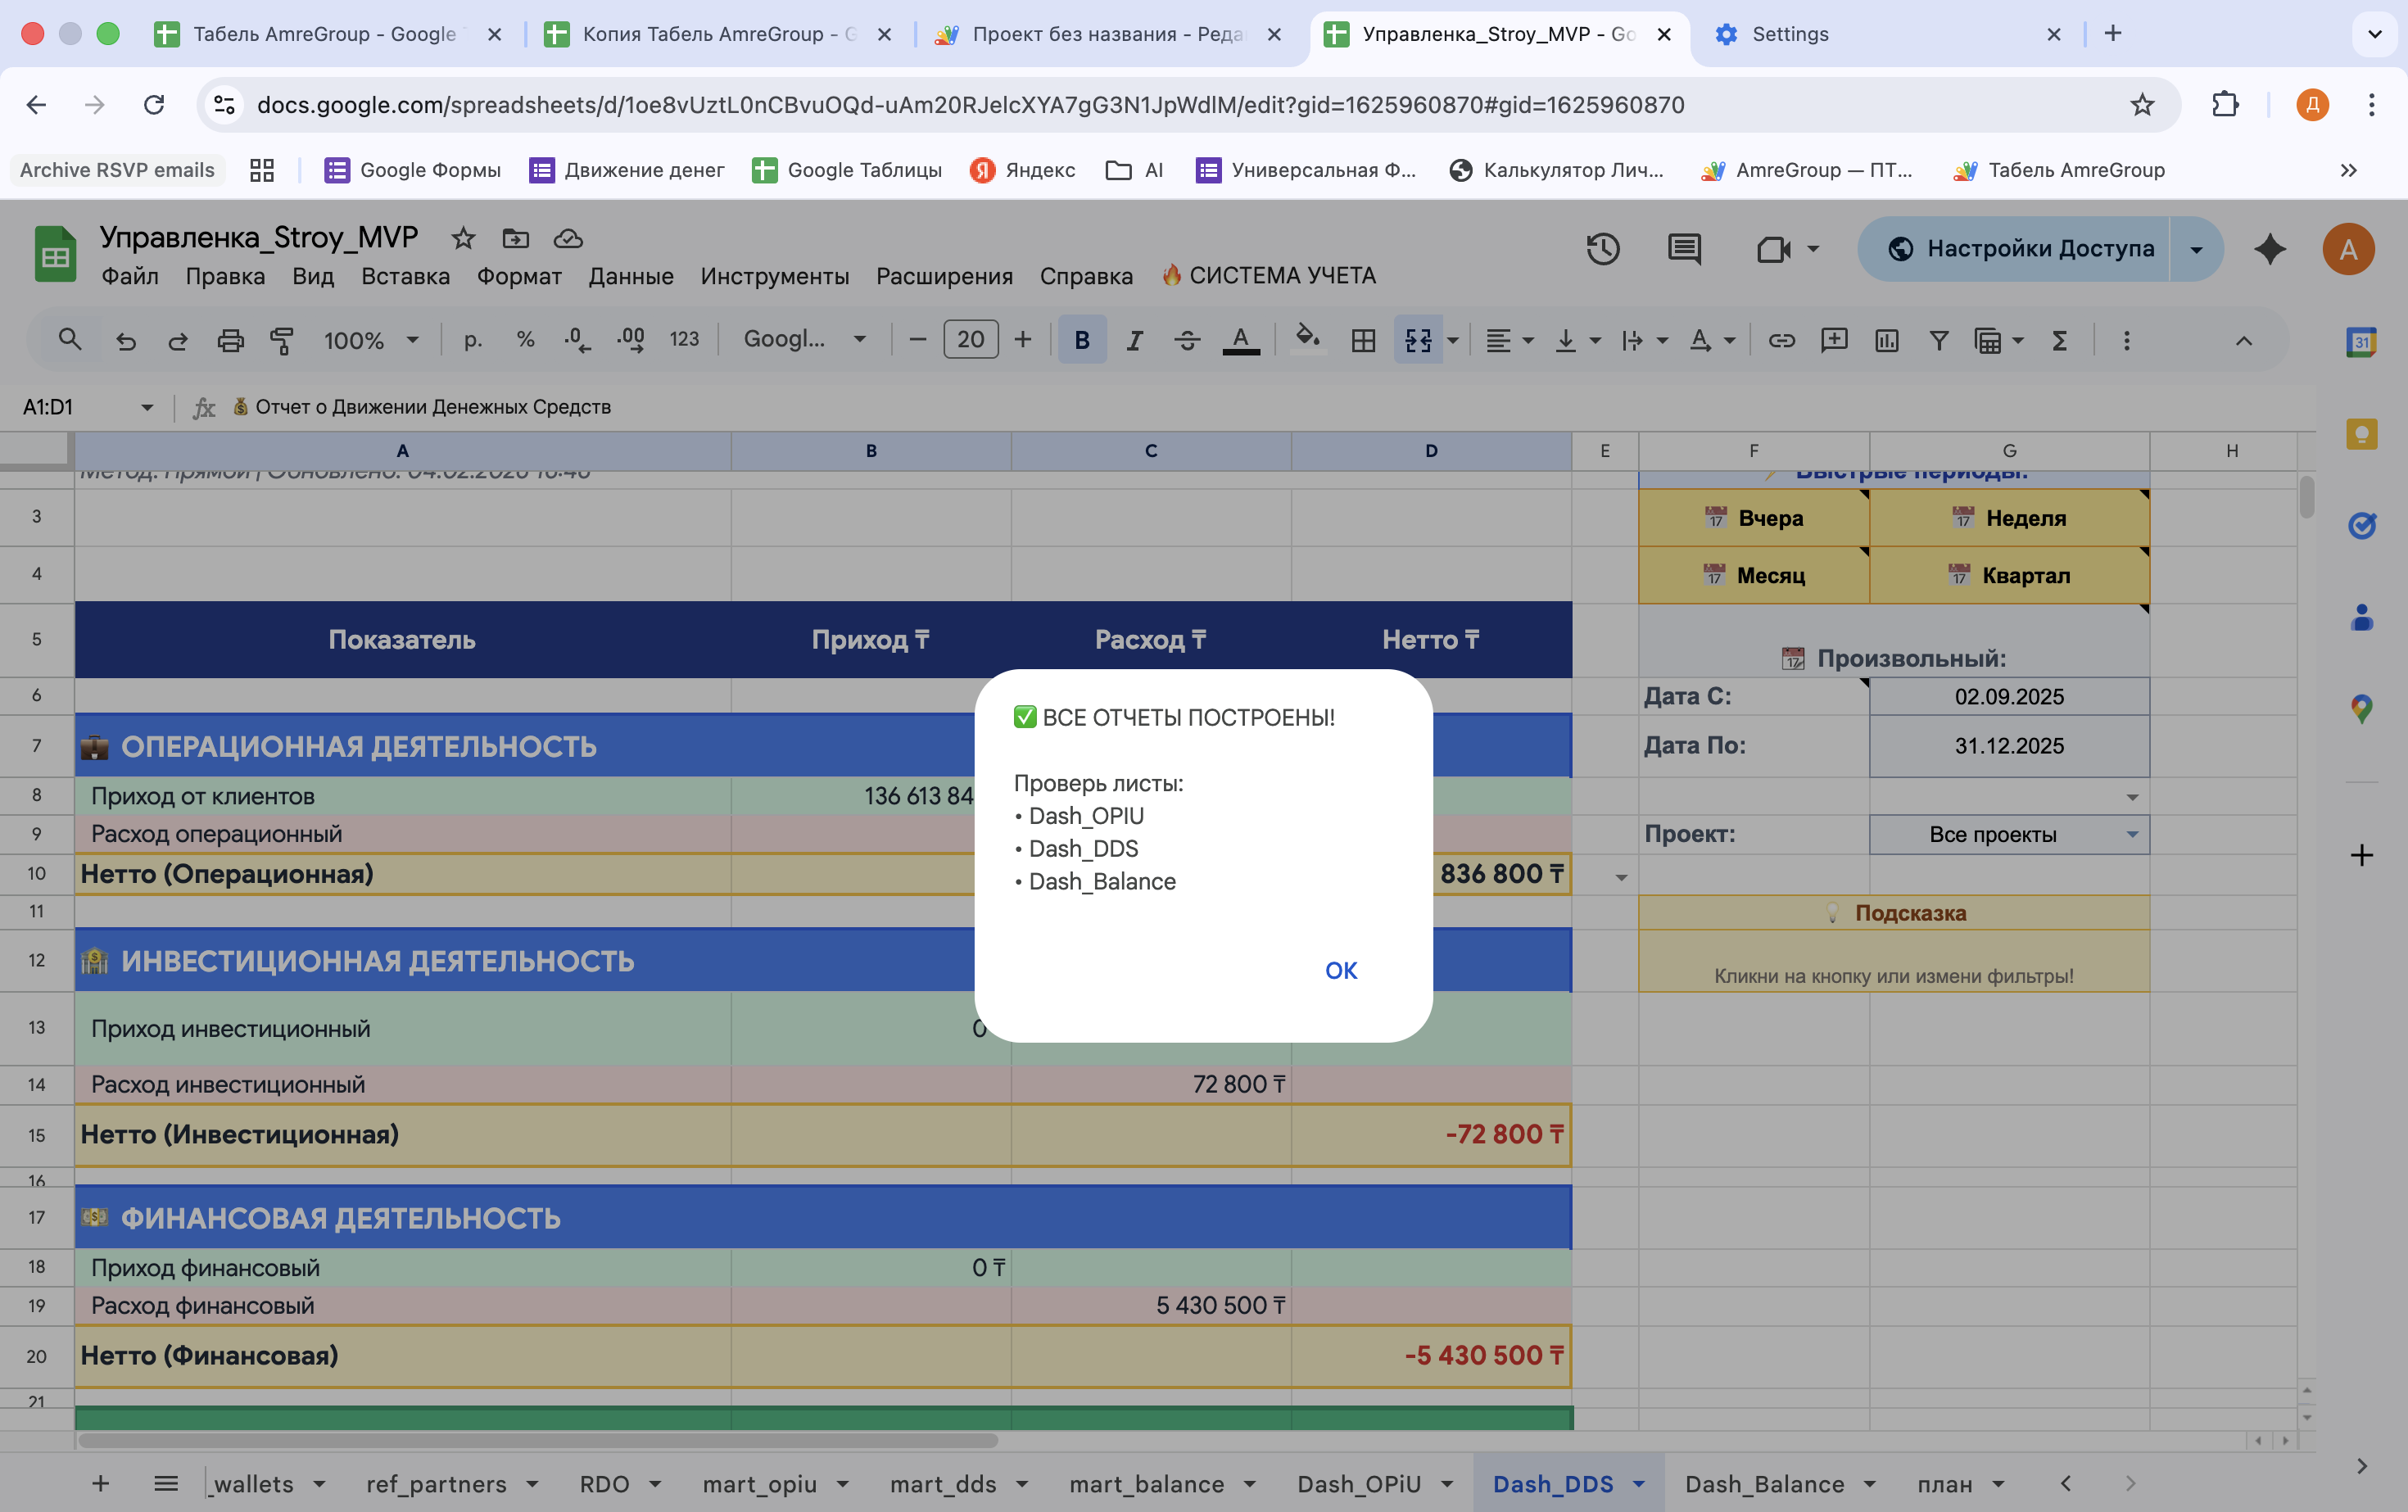
Development of a complex financial accounting architecture for the construction business. The system automatically transforms "raw" transaction data into three main reports for the owner (P&L, Cash Flow, Balance), eliminating the need for a staff of financial analysts.
What has been implemented (The Architecture):
Three-tier data model:
Raw Data Layer: Collection of "raw" data through forms and imports (PTO, SCM, Banks).
Marts Layer (Data Warehouses): Automatic normalization and distribution of data across registers (P&L, Cash Flow, Balance).
Dashboard Layer: Visual interactive reports with filtering by projects and periods.
The Big Three Reports:
P&L (Profit and Loss): Accrual basis profit and loss report (Revenue, COGS, OPEX, Gross and Net Profit).
Cash Flow: Direct method cash flow statement by three types of activities (Operating, Investing, Financing).
Balance Sheet: Real-time control of assets (cash, receivables) and liabilities with automatic verification "Assets = Liabilities".
Security and Audit: Implementation of Audit Log, which records who made changes to the system and when — a critically important feature for financial software.
Technical Stack:
Google Sheets Pro: Use of highly complex formulas for data normalization.
Data Modeling: Building relationships between directories (Projects, Expense Items, Partners, Wallets).
BI Logic: Automatic recalculation of financial indicators when filters are changed.
Result for the business:
Financial Transparency: The owner sees real profit and cash gaps on one screen.
Project Accounting: Ability to see the margin of each individual object (NVC, OVC) instantly.
Data Accuracy: Automation has eliminated manual entry errors and "drawing" numbers in reports.